


Draft page under construction
This guide is for teachers new to the IOT in Schools project. Local authority schools in the south east of Scotland — East Lothian, Edinburgh, Fife, Midlothian, Scottish Borders and West Lothian — have the offer of sensors, gateway and associated web services, free of charge from the University of Edinburgh.
Have you got a LoRaWAN Gateway in school?
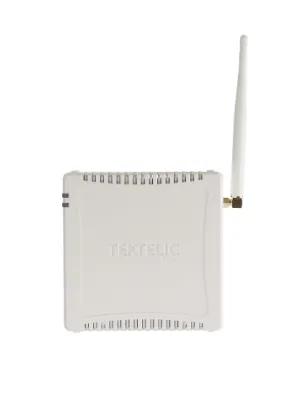
Tektelic Kona LoRaWAN Gateway
If you have been given a LoRaWAN Gateway similar to this device, the first thing to do is plug the adapter into an electrical socket. It is best located somewhere where it will not be switched off and preferably not inside a metal cupboard.
It has to be turned on 24/7/365 — it listens for any sensors in the school and local community and transfers the data to the University of Edinburgh.
Find your indoor environment sensors
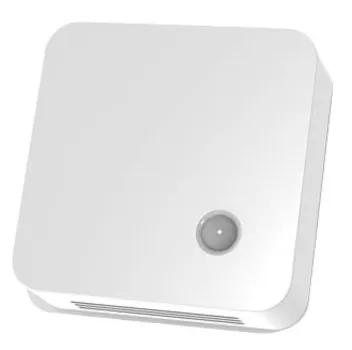
Elsys indoor environment sensor
Every school is given a small number of indoor environment sensors like the one shown here. Some have a small LCD screen and others have a solar panel.
Depending on the model, they can measure:
Data is sent every 10 minutes to the University’s servers and displayed as a line graph.
Check your data is coming through
No complicated setup is required — the technology usually works straight out of the box. Before letting learners loose with the sensors, check that data is coming through from your school.
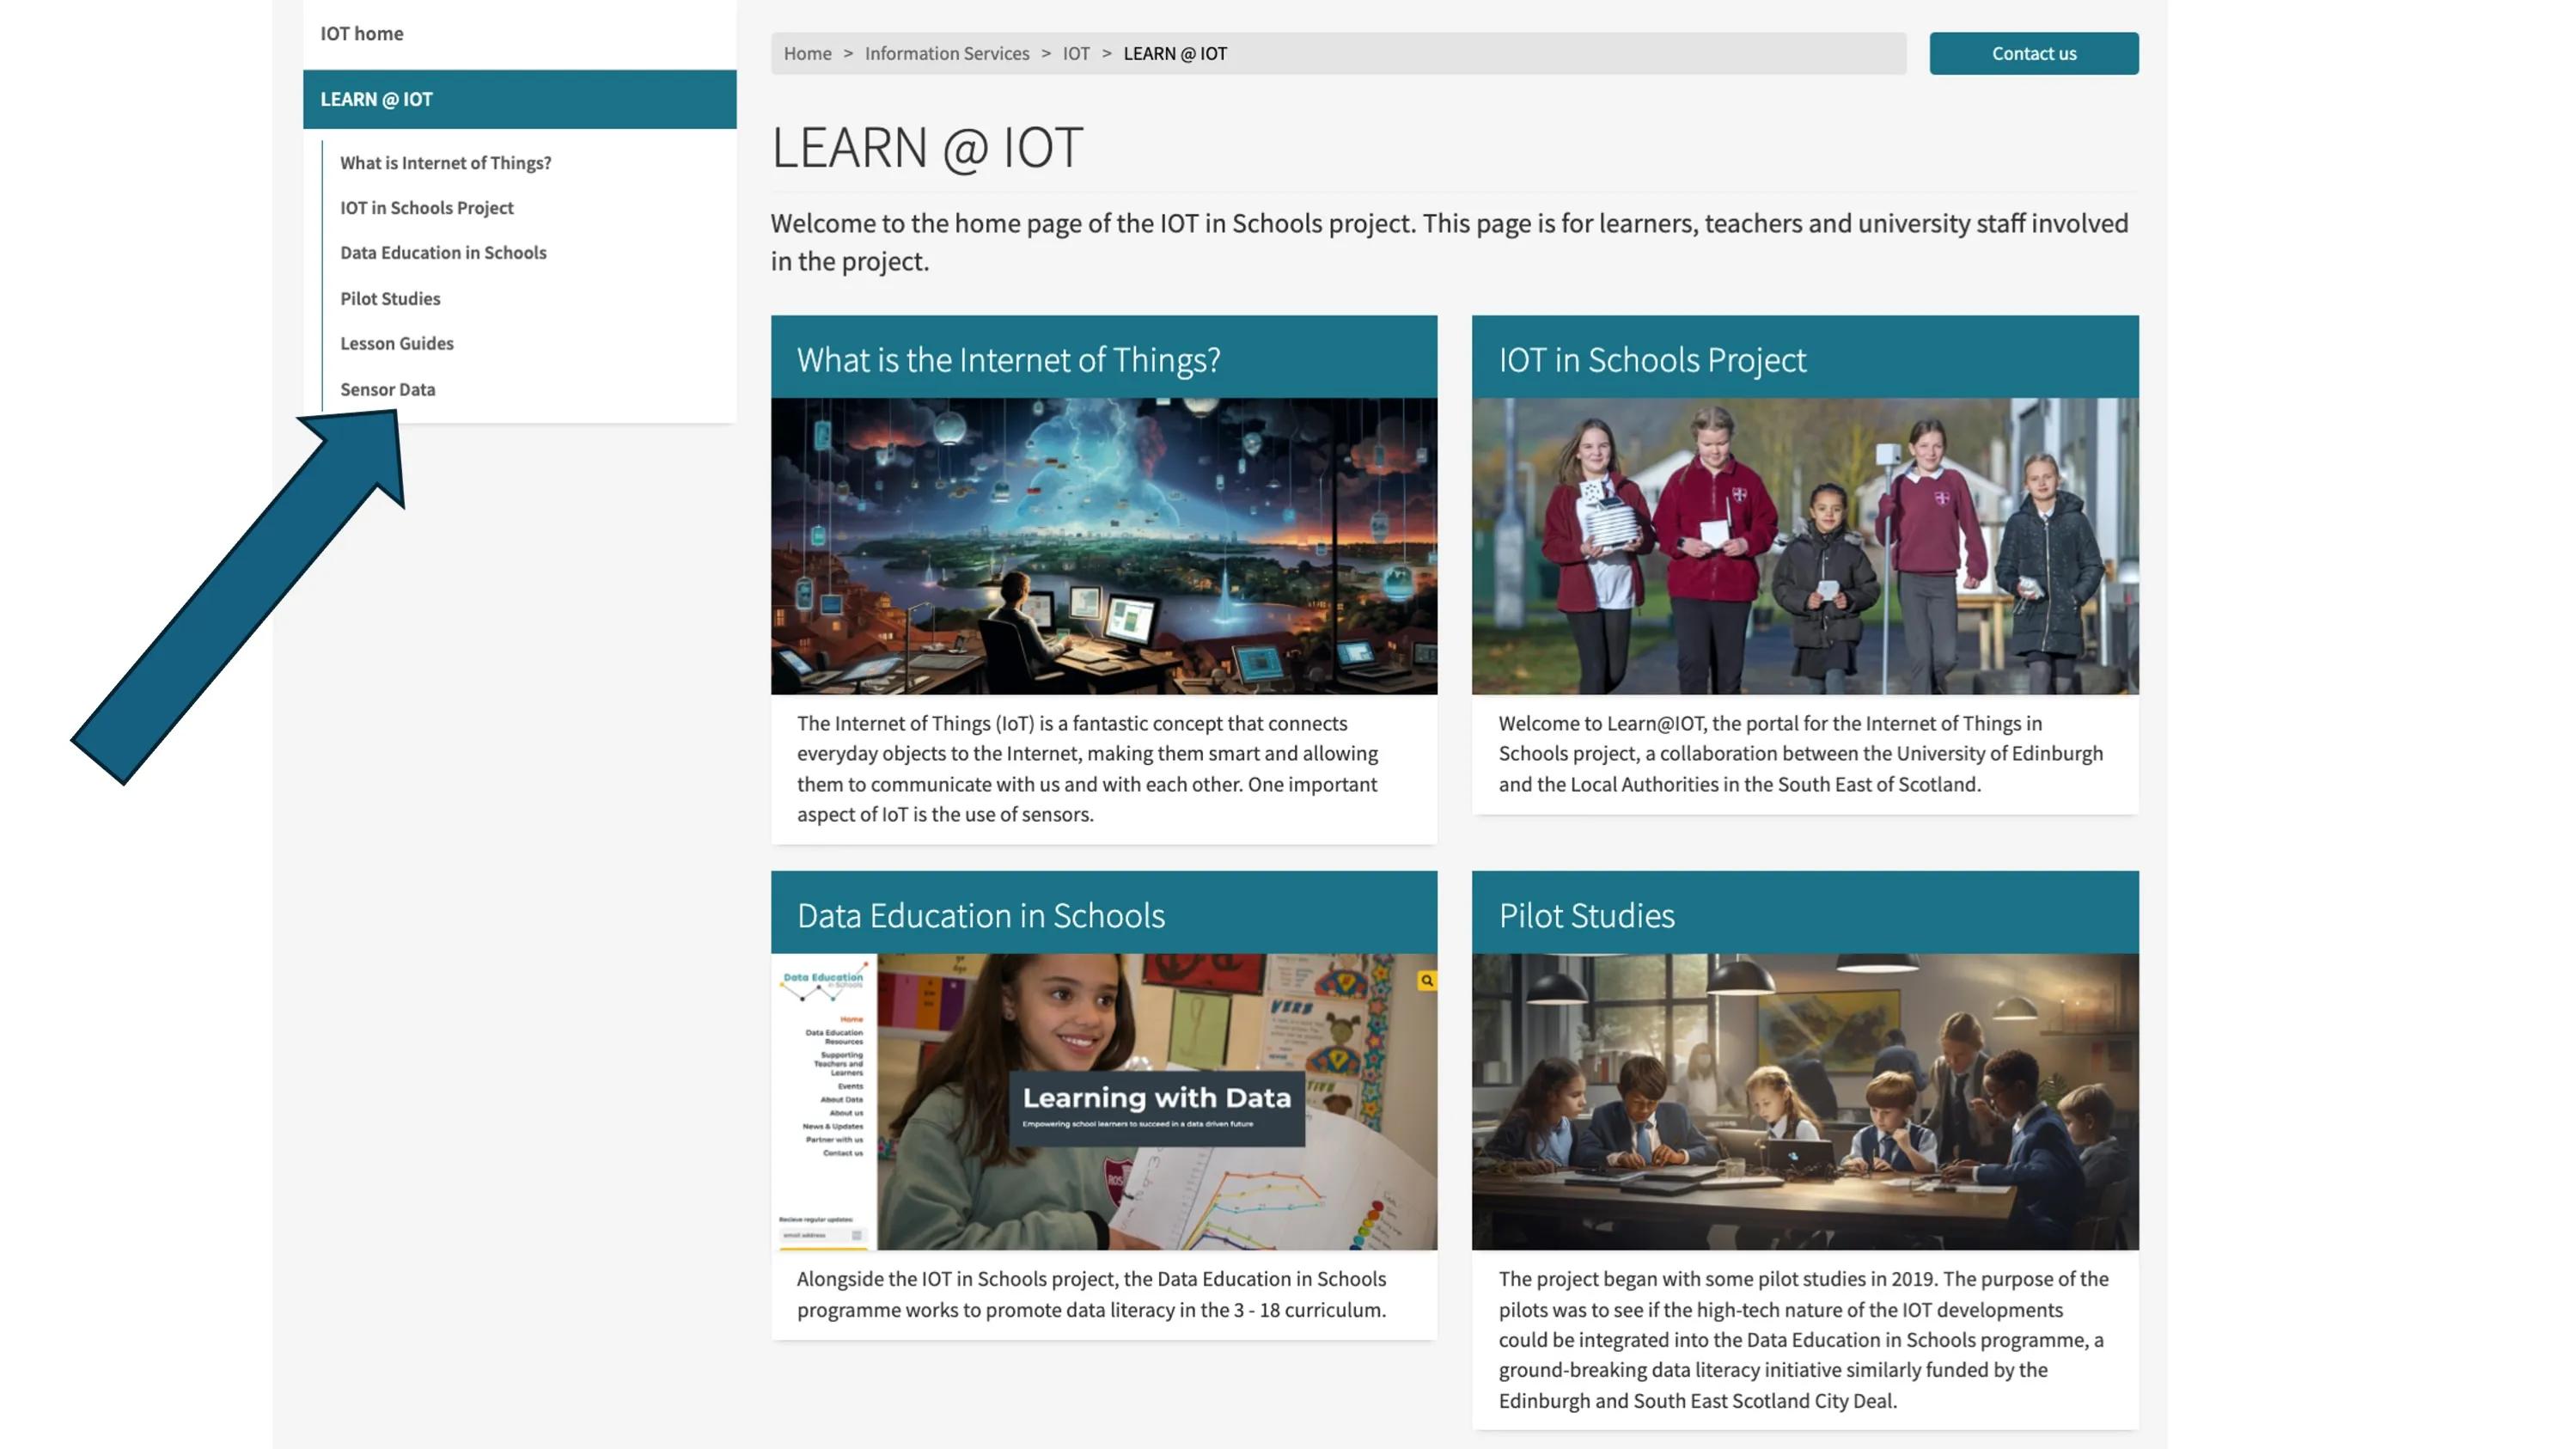
On a computer, tablet or mobile phone, open: learn.iot.ed.ac.uk
3a — Click on Sensor Data
3b — Click the link to Sensor Data in Schools
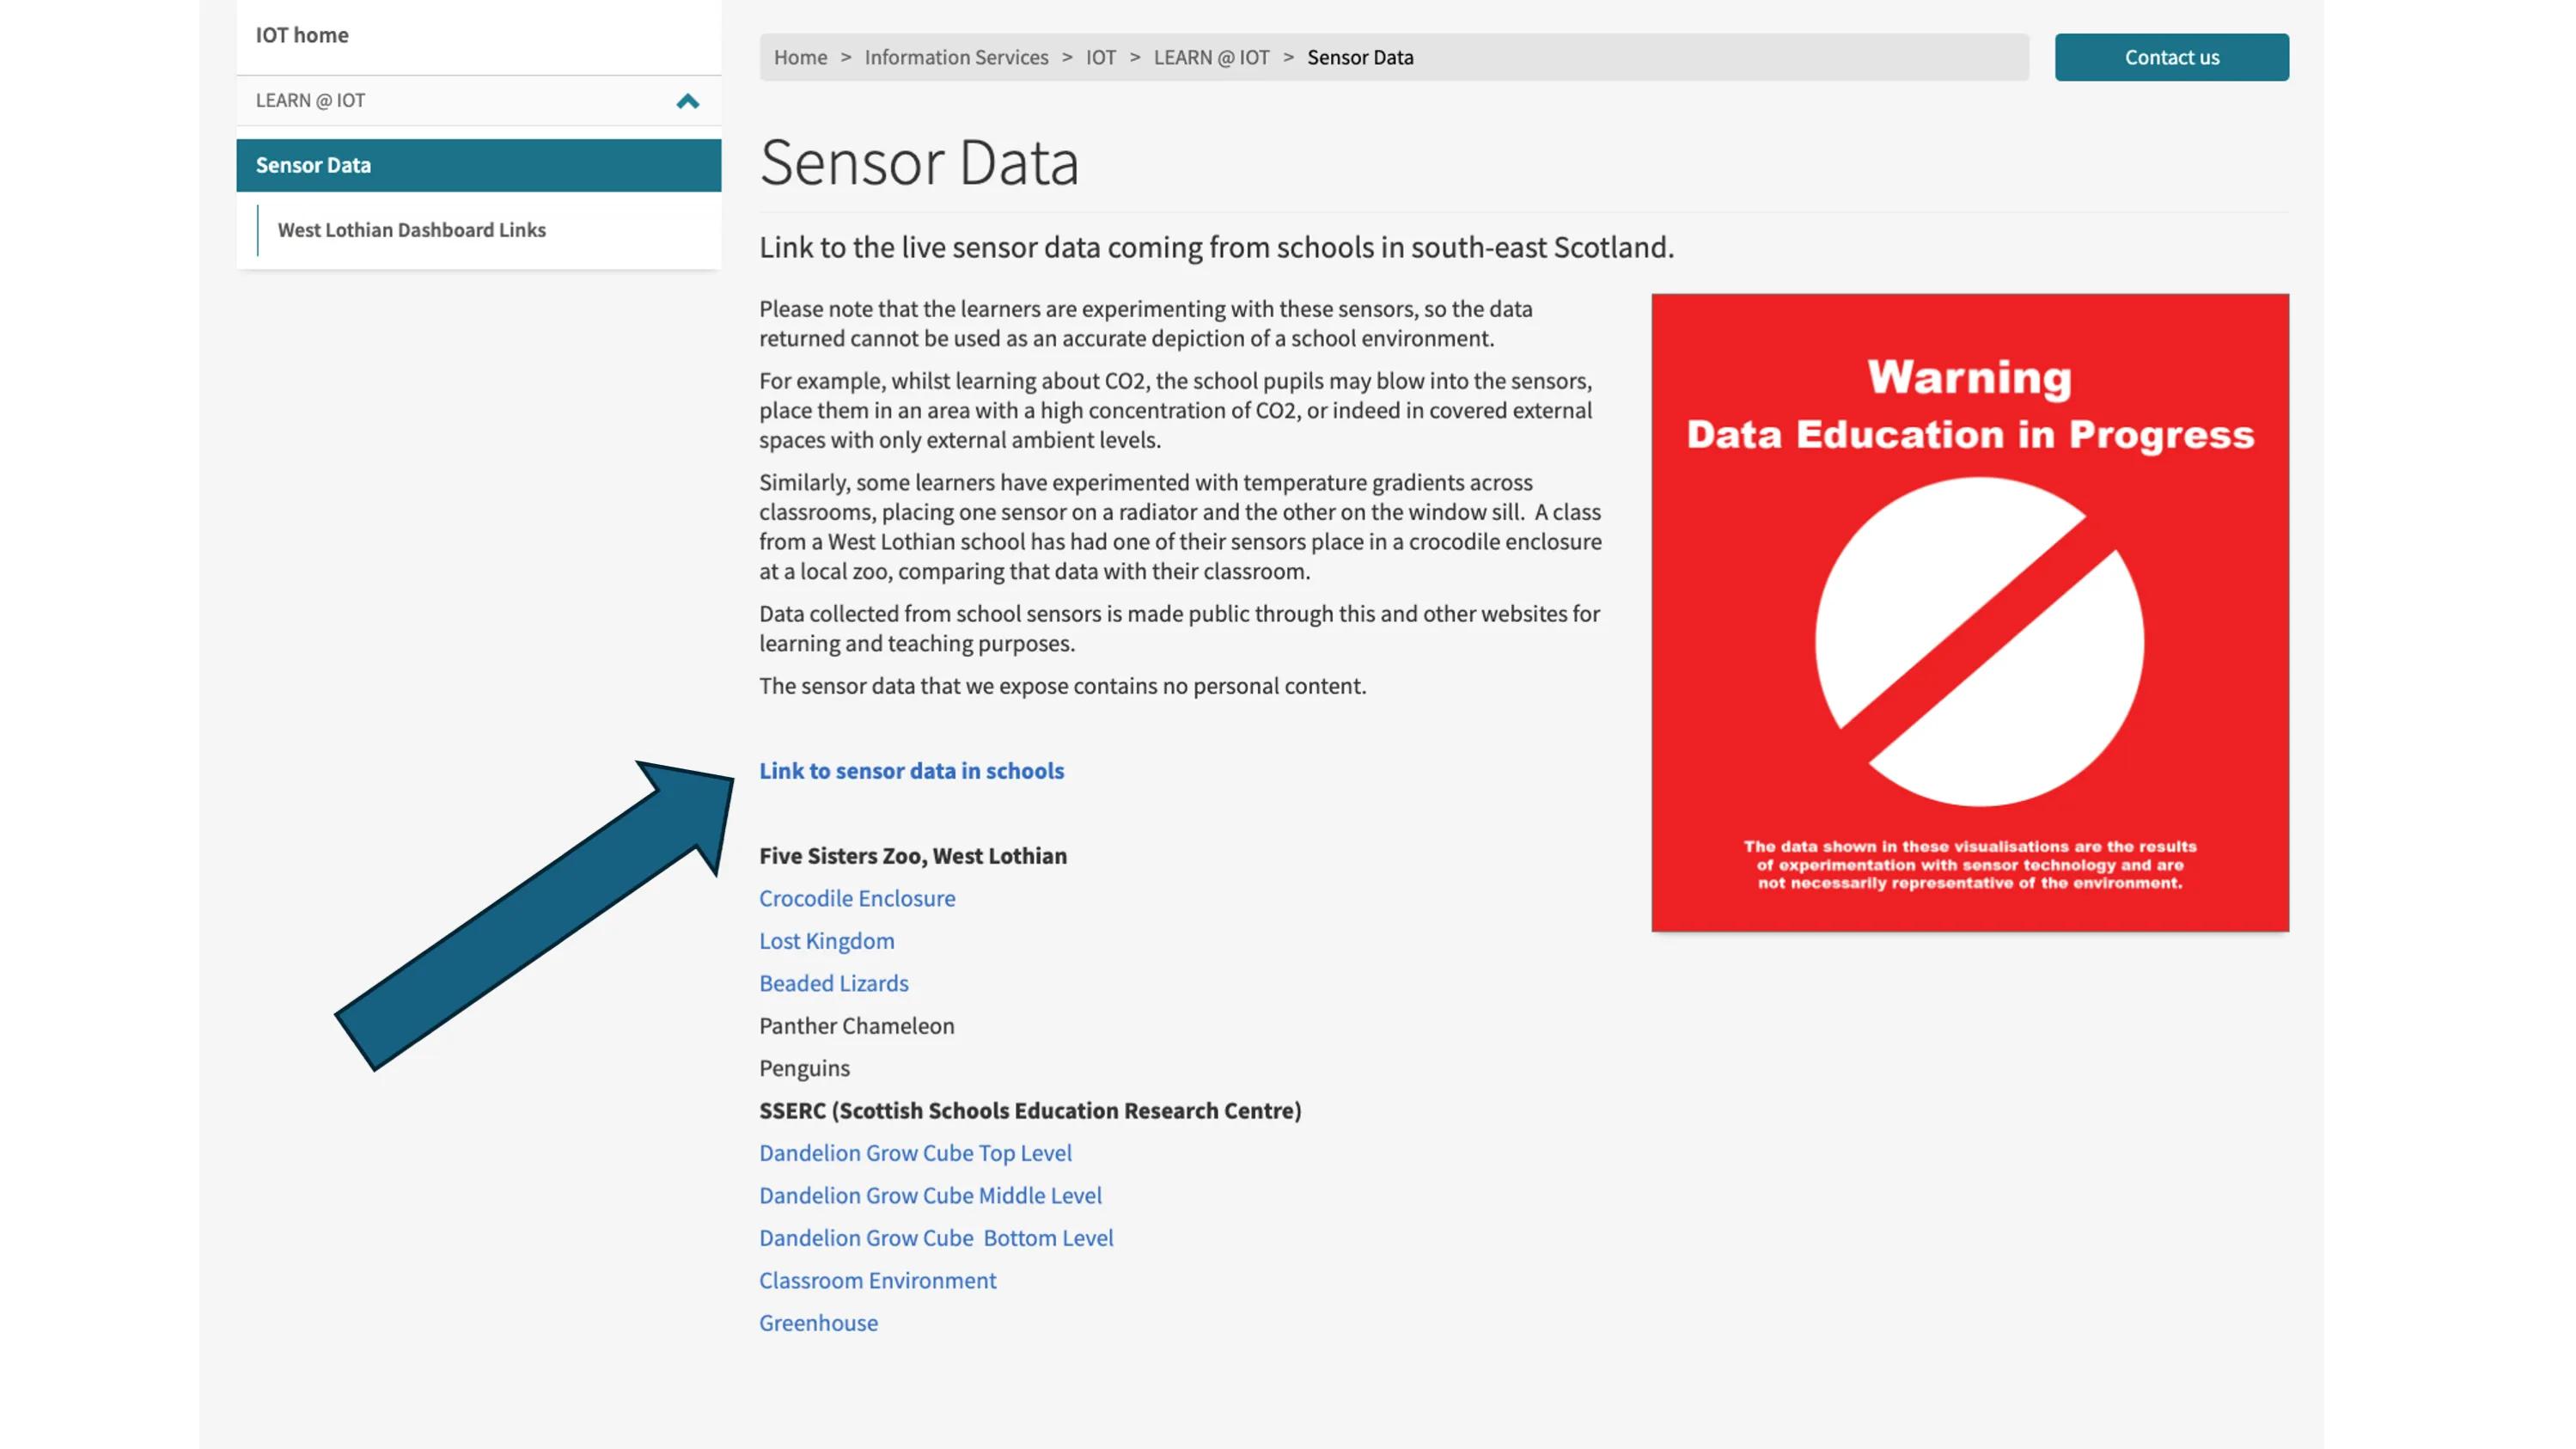
3c — Choose your school region and school name, then select a sensor
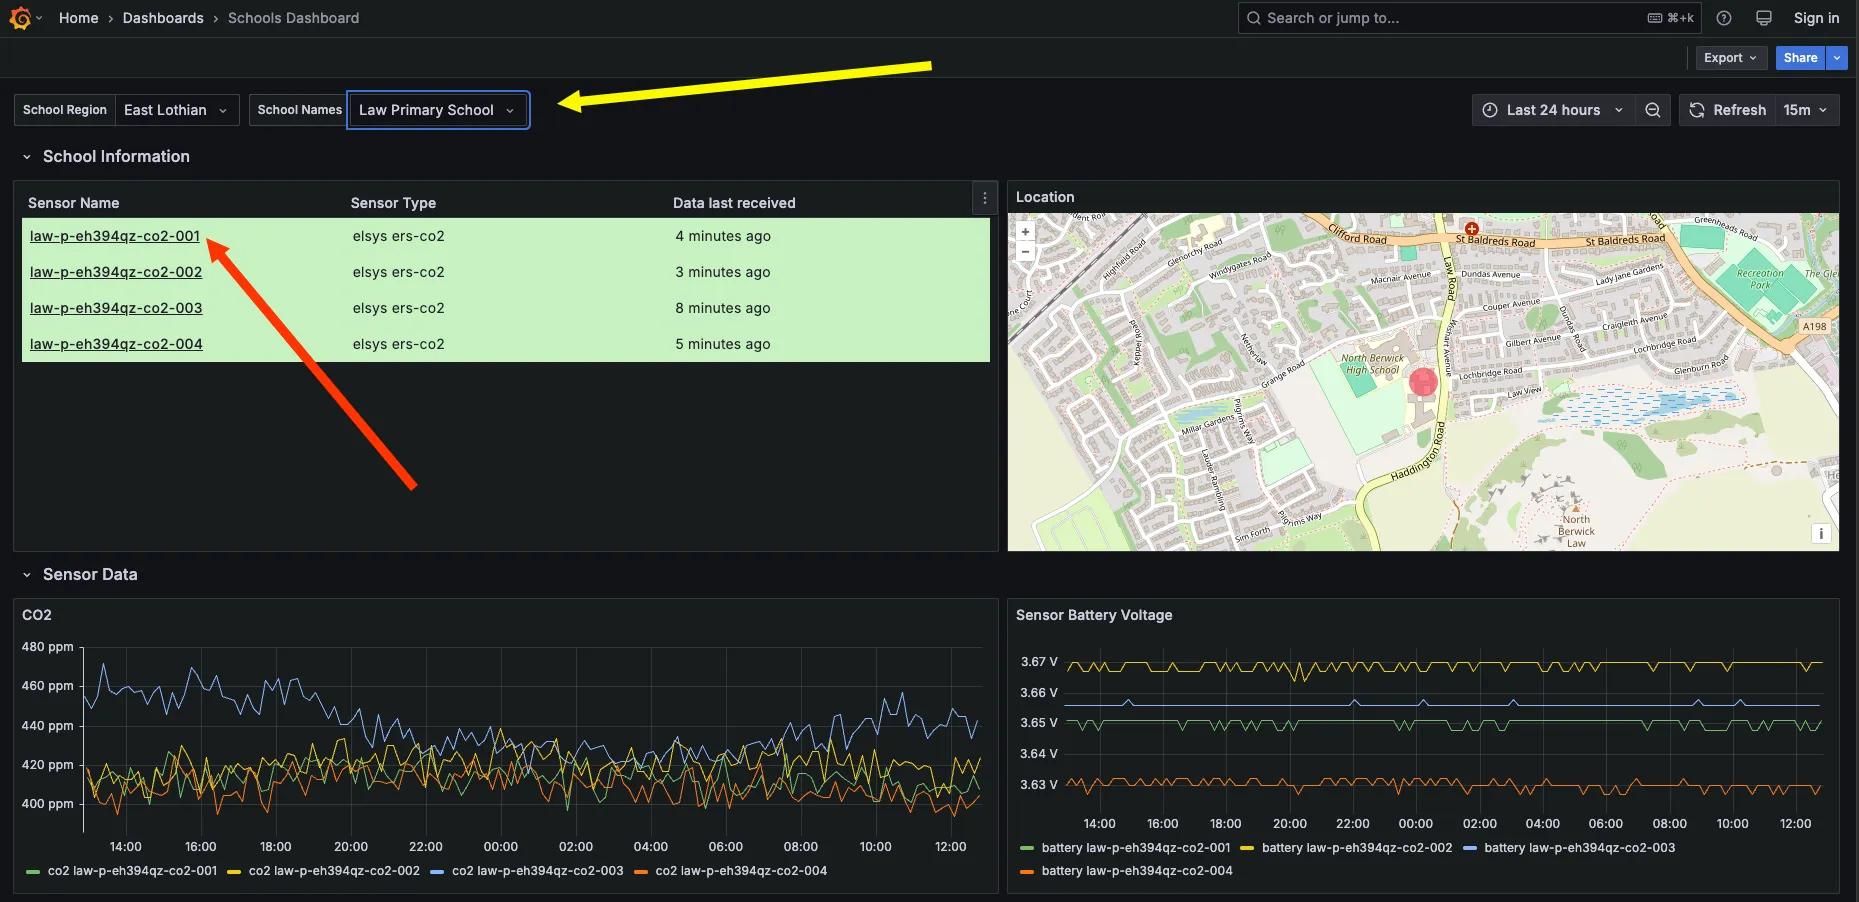
Sensors with a green background are active; red means not currently transmitting.
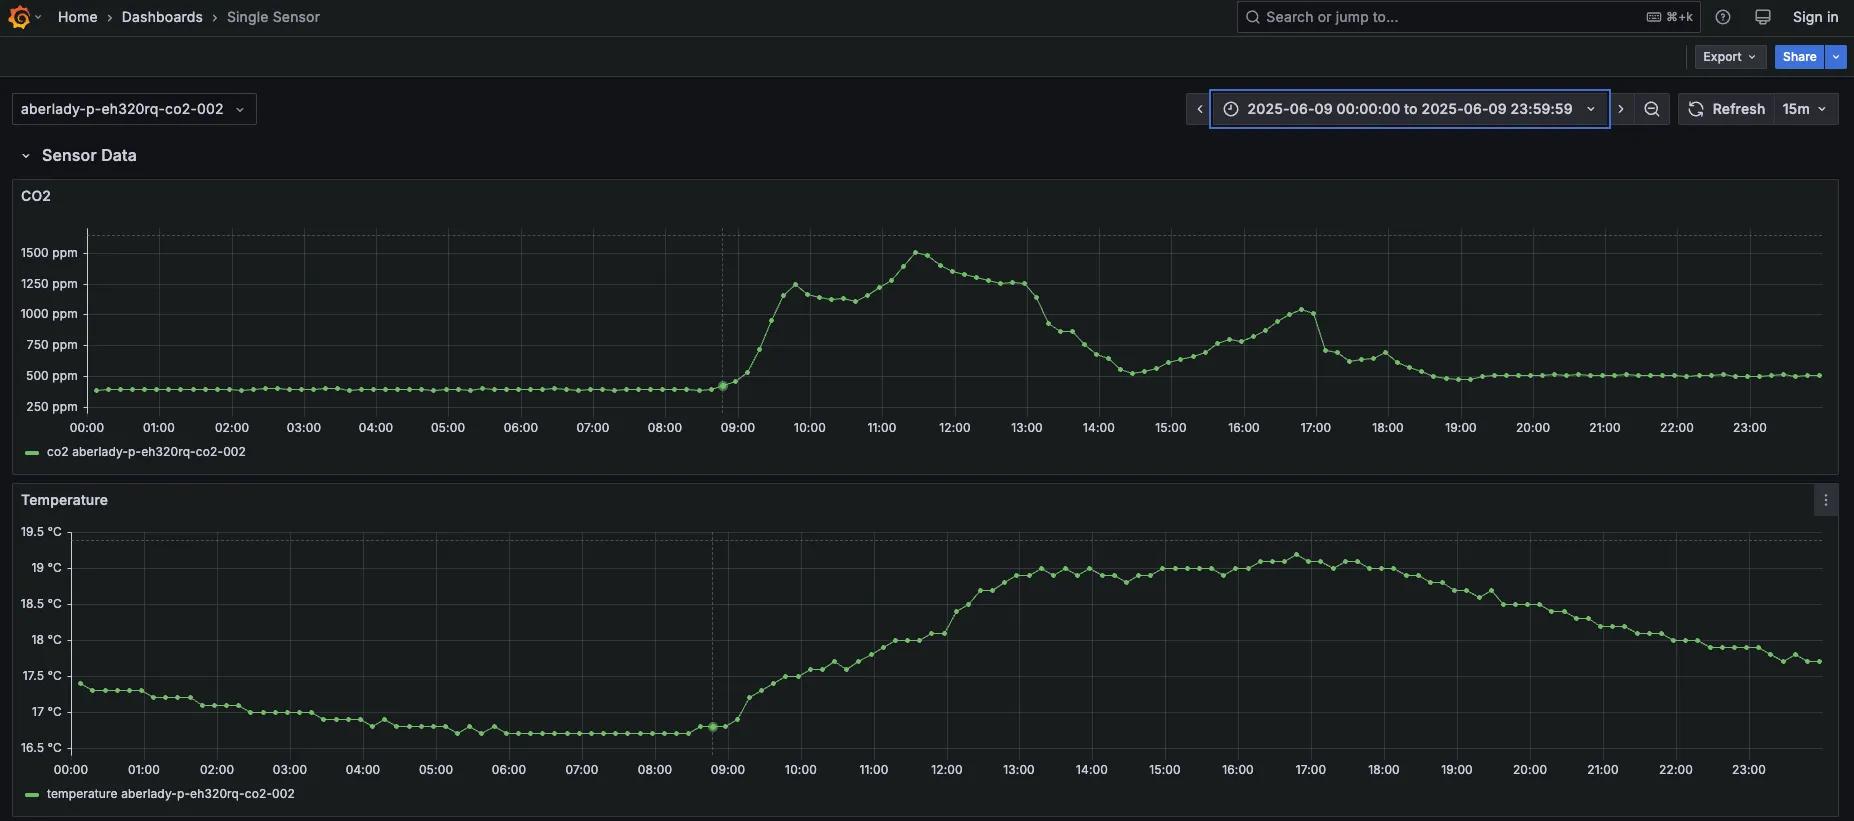
3d — Your sensor’s live data graph
Give the sensors to the learners
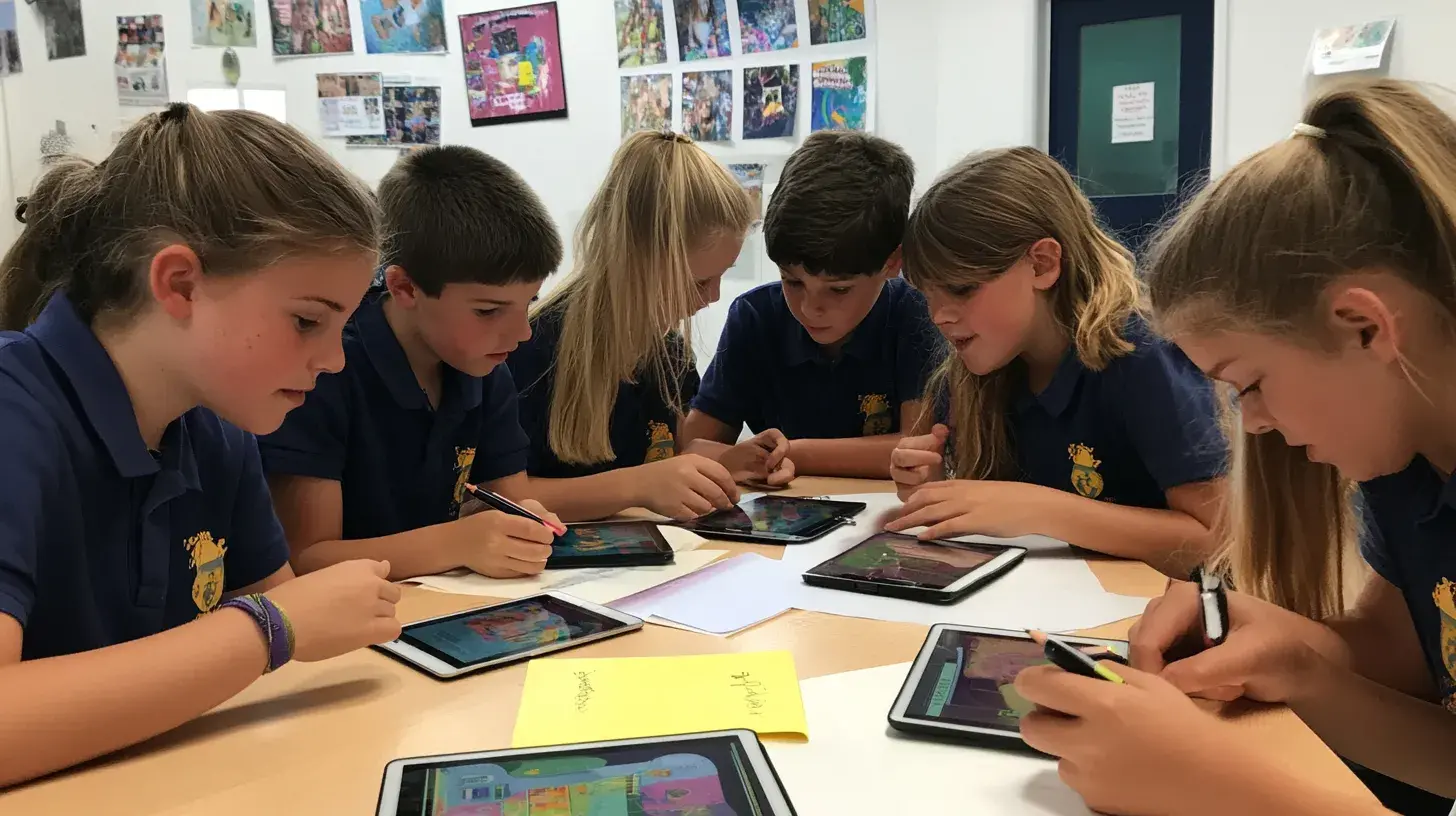
Learners exploring sensor data in class
We’ve found in most schools that the best way to engage learners is to let them explore and discover their environment through data.
Many schools give two sensors to a class — one to collect ambient data from the indoor environment and one placed somewhere that produces different data, such as:
- The dining room
- The library
- The headteacher’s office
- The school kitchen
- A greenhouse
- Under the eaves of an outdoor hut
Before moving on to lesson guides, spend five minutes a week encouraging learners to describe what they see on the graphs. Start with questions like:
- Why does CO₂ increase gradually when school starts in the morning?
- Is there any data that can tell you when the school breaks are?
- When does it get light in the morning and dark in the evening?
- What units are used on the horizontal and vertical axes?
- What is atmospheric pressure?
- How does classroom temperature compare with the weather outside?
Their dialogue and vocabulary when describing the data will develop throughout this time.
Look through the lesson guides

Lesson guides tagged to CfE outcomes
Choose a lesson guide that suits your class. You can use a small part of one, combine several, or work through them in sequence — they’re designed to be flexible.
All lesson guides are:
- Tagged to Curriculum for Excellence (CfE)
- Available in MS Word, MS PowerPoint, and PDF formats
- Created by teachers, for teachers
Published 8 October 2024 | Contact us