


Selfie ‘a photograph that one has taken of oneself, typically one taken with a smartphone or webcam and shared via social media.’
In developing our second live lesson for the Data Education in Schools programme, we took the idea of the ‘selfie’ and played with it as only data scientists know how, questioning its underlying assumptions and challenging ourselves to think about the data involved. Does a selfie need to be a photograph? In what way does it need to be representative of yourself? Would you recognise yourself from a visualisation of data about yourself?
We’re surrounded by data, generating it every day often without giving it much thought – our activity levels, our Spotify playlists, gaming purchases, YouTube subscriptions, the bus journeys recorded on our travelcards, even our sleep cycles. We exist as data in a way that is completely separate from how we see ourselves when we look in the mirror or at photograph of ourselves.
And so the idea of the ‘data selfie’ was born.
Our first Data Selfie live lesson took place on 28th April 2021. Craig Steele and Daniel Devine (Digital Skills Education) took up residence in their virtual portrait gallery along with visitors Jen Sykes, creative technologist at Glasgow School of Art and our very own Kate Farrell (Director of Curriculum Development and Professional Learning) who were invited to talk about their work. Jen linked to the history of portraiture and reminded us that a self-portrait might offer insight of a personality rather than being representational image and that any creative means can be used – paint or code! Kate talked about how data visualisations can feel personal and gave learners an insight into different types of visualisation, including Stefanie Posavec and Griorgia Lupi’s book ‘Dear Data’. Here is the link to our ‘Dear Data’ resource.
Kate also helped to position the importance of data visualisation in decision making.
‘Visualising data allows us to see patterns more easily than looking at numbers. We can make predictions on the back of that’ – Kate Farrell
While Craig and the team chatted during the live You Tube stream, learners across the country (and beyond) worked through a series of browser-based activities to engage with and alter P5JS code – our digital canvas.
Learners shared data about themselves including their height, eye colour and hobbies. Running the code produced a visualisation which learners could then send to our virtual portrait gallery.
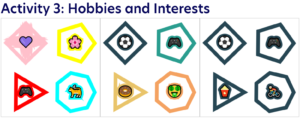
Image: An image from the Data Selfie virtual portrait gallery bringing together time spent engaging with particular hobbies and the participants level of enjoyment from their interests.
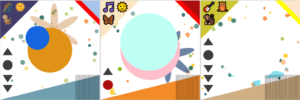
Image: Examples of abstract data selfie portraits from the final live lesson activity.
By the end of the event Craig and Daniel had received 500 self portraits from 213 learners based in 13 schools.
While the data selfie event was a playful way to engage learners with coding and visualisation it has a serious underlying aim: to ask learners to question the data they share, consider what it might say about them and reflect on their data privacy.
Since the event ran last month, the web-based data selfie resource has recorded over 1500 engagements. What can we conclude from this? Our data self-portrait is looking good and we can’t wait for our next live lesson.