


Humans have been drawing information visually since the times of the cavemen and we have been recording data in tables since the 2nd century. However, the person seen as the father of statistical graphics was a Scot, William Playfair (1759-1823).
William Playfair is not to be confused with his nephew, William Henry Playfair (1790-1857). The younger Playfair designed many historic buildings in Edinburgh such as Old College and Surgeon’s Hall on South Bridge, The Royal Scottish Academy on Princes Street, and Donaldson’s College at Haymarket.

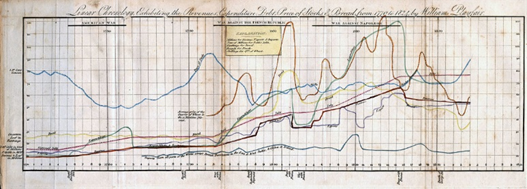
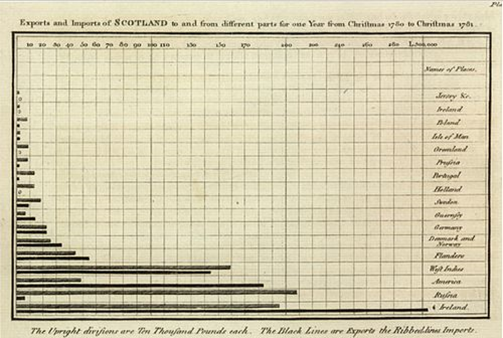
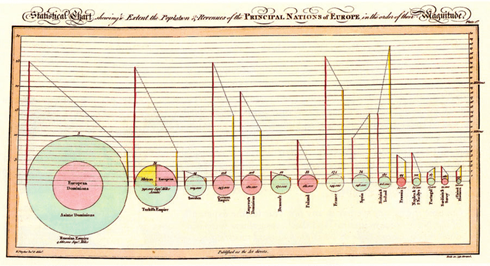
The older Playfair started to present data in ways that are still familiar today. He is credited with inventing the line, bar and pie charts. He was also an early adopter of a time series graph.
Find out more about historical graphs and how Scotland has helped develop data visualisations from our friends in the Maths department at the University of Edinburgh:
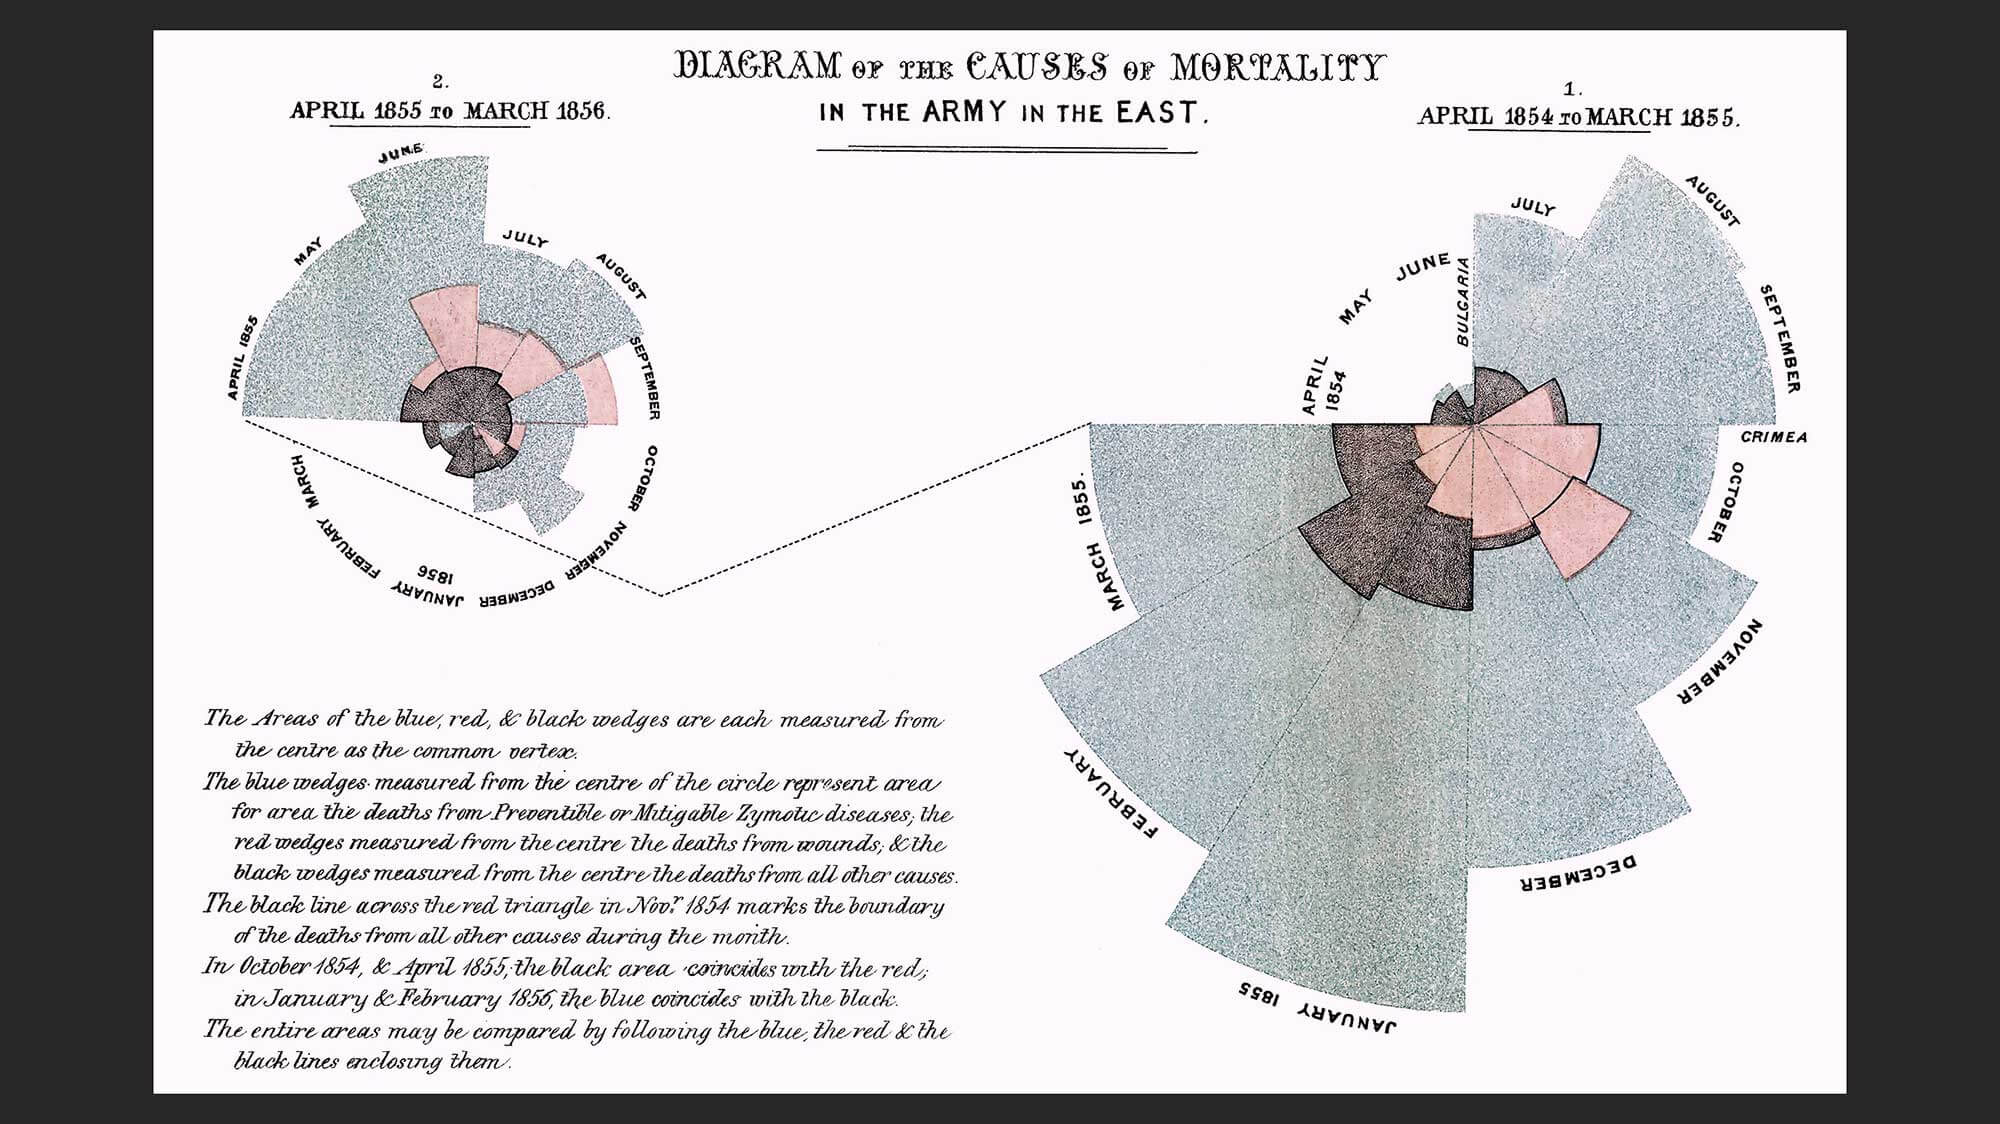
After Playfair, there were a number of key figures who helped to move the data visualisation world forward. This includes Florence Nightingale (1820-1910) who created Coxcomb diagrams which showed causes of death in the Crimean War.
We liked this this animated video from the BBC which tells about Florence Nightingale and her data visualisations: