


An activity to help students start thinking about data! Students create three dimensional bar charts from data cards. This gives them an intuitive understanding of how individual data points link to a visualization, and why a visualization is useful.
Download Lesson Plan Here: Data Cards Lesson plan
What you need
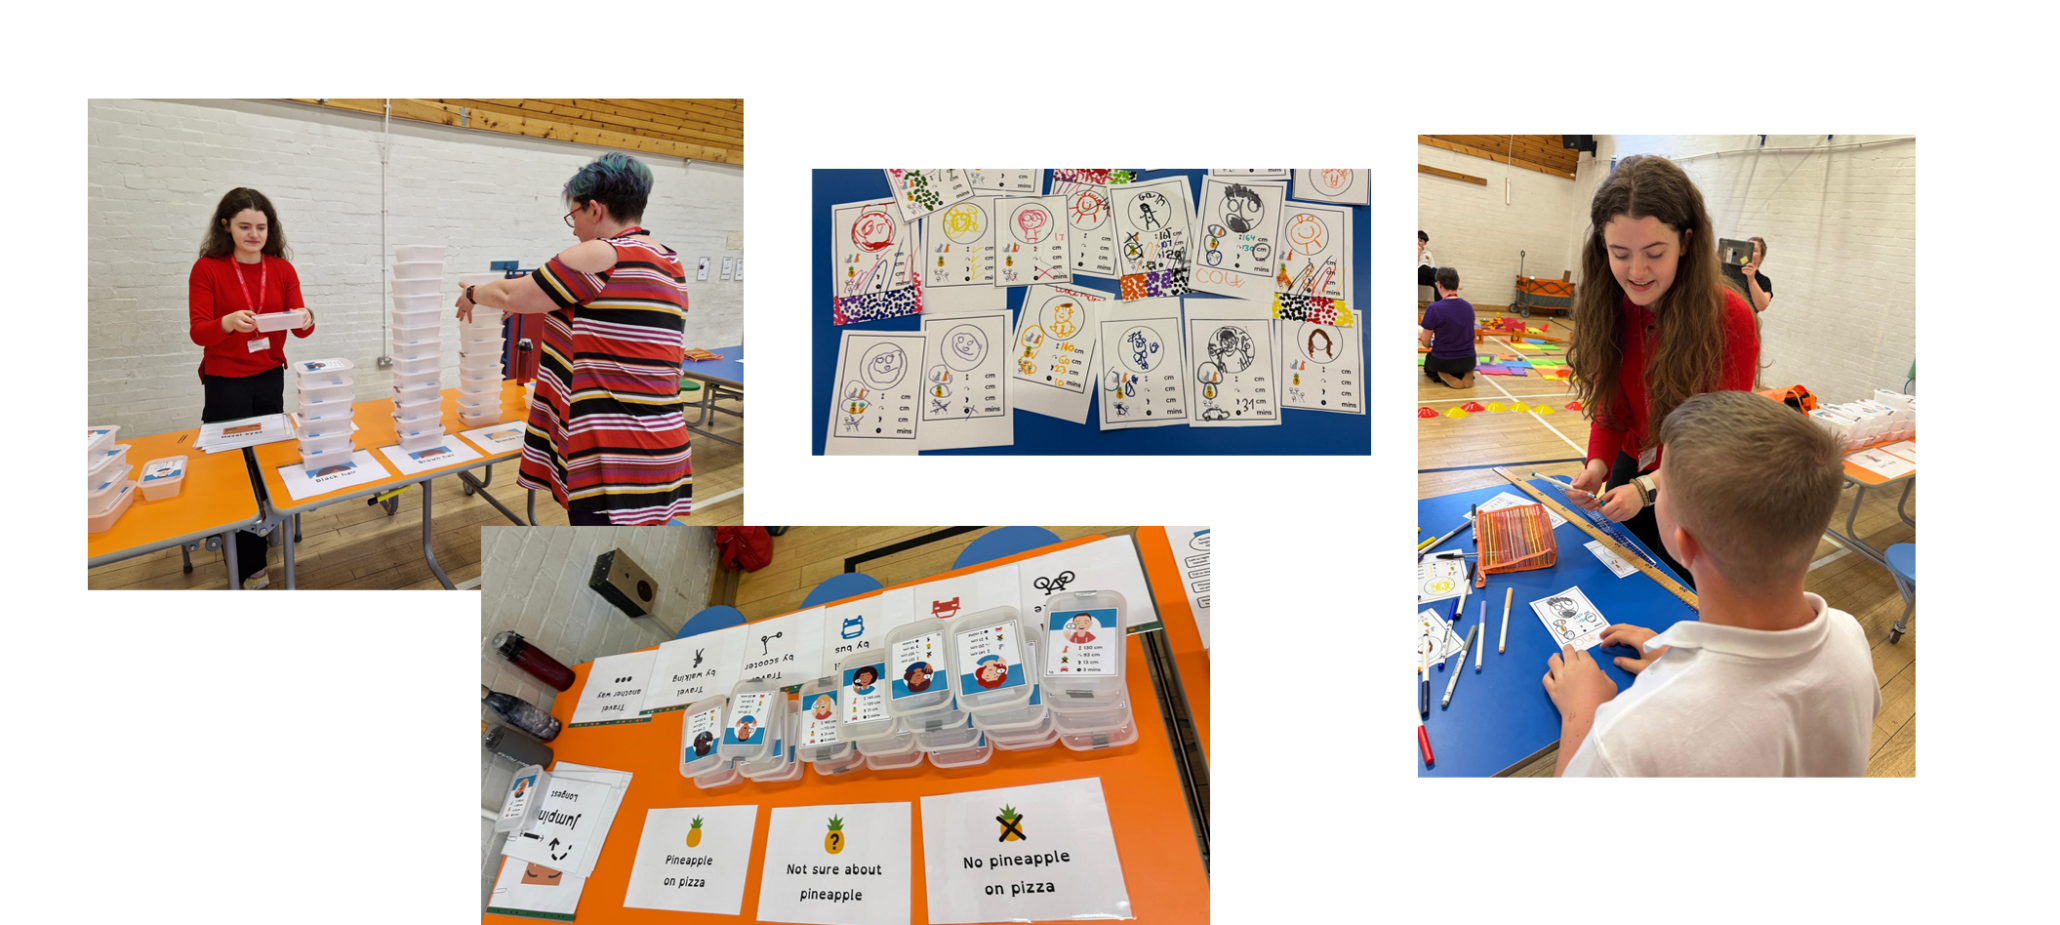
- Uniform blocks or boxes (for example plastic takeaway boxes). The amount you will need depends on how many students will be simultaneously taking part in the activity. For a group of 5 we would recommend 50 boxes. For this reason this activity is best delivered in small groups.
- Printed data cards. We recommend the CensusAtSchool Data Cards which are from New Zealand (CensusAtSchool website). We have made a version of the cards sized at A6 each available here: NZ Data Cards
- Printed category headings (optional). These specify the different attributes for example (red hair, black hair, blonde hair, brown hair). These are used for building the towers on top of. But the activity can still be down without these.
To-do before the activity
- Print out the data cards and cut them out.
- Stick one card onto each of the blocks / boxes.
Activity
- Ask students to stack cards by different variables (a good place to start is hair colour). They will create 4 towers, one for each hair colour.
- Once they have created each tower, ask which hair colour is the most common. They should say the tower which is the highest. This links the core idea of data points being linked to graphs, and the use of visualisations in ease of data understanding.
- This can be repeated with other variables such as eye colour, transport option, or whether they like pineapple on pizza.
- Another activity is ordering the boxes by numerical variables, if your class is confident.