


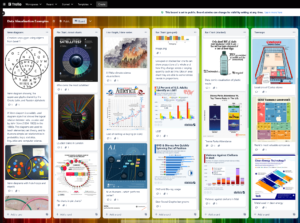
We have pulled together an (ever-growing!) set of data visualisation examples, categorised by type—e.g. bar charts, pie charts, line graphs, scatter plots, histograms, heat maps, and many more—as well as curricular level at which we would expect comprehension and creation of each graph.
Find a visualisation to use as a starting point for a lesson or a conversation with your learners, or have your learners look through some examples before creating a data visualisation of their own.
© Data Education in Schools, University of Edinburgh, 2024. This resource is licensed CC BY-NC 4.0, unless otherwise indicated.