


Music is a creative, imaginative subject so it’s difficult to see how data can support that creativity. We’ll look at the many ways data can help musicians and those in the music industry.
Charts Data
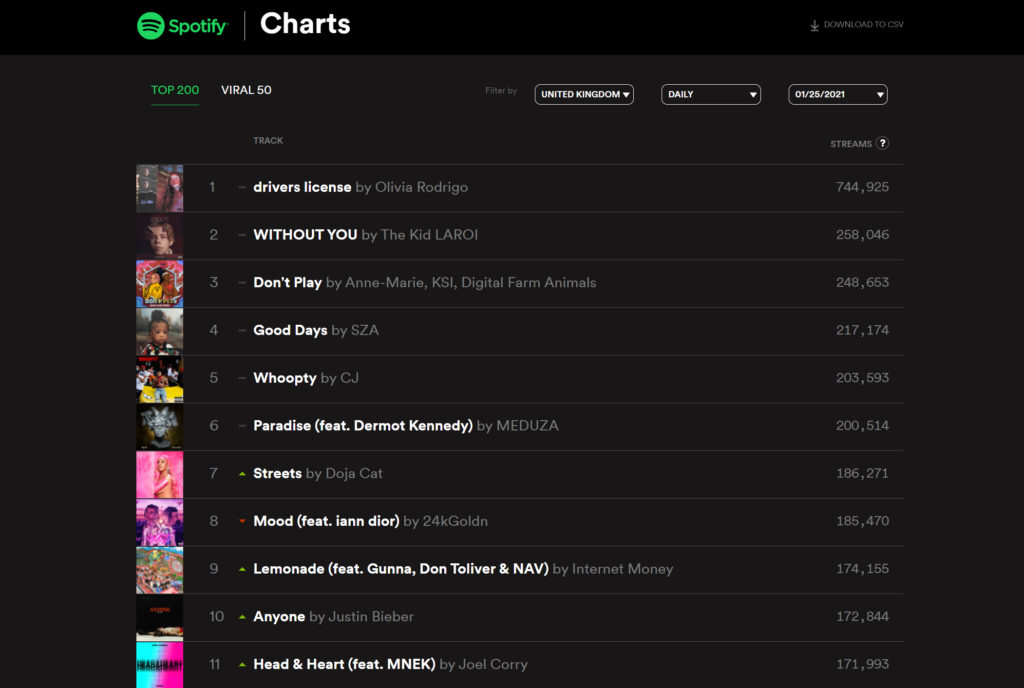
A database of top 10 charts over the years is probably the first thing people think of when asked about data in music. We can look online at charts data going back years. We can also look at charts of the most popular music in different countries around the world.
You can use other tools to discover the popularity of music too, such as Google Trends. This can show how many people are searching for the lyrics of a song, for example. This is a graph showing the increase in the searches for the term “sea shanties” since 2004.
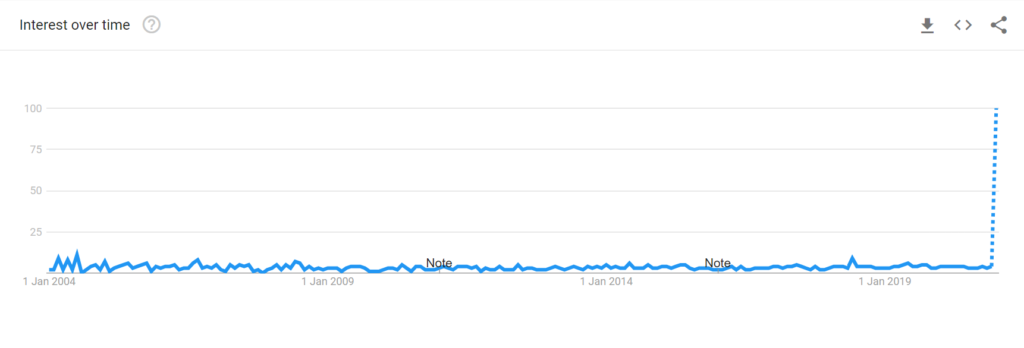
Why not try searching Google Trends for other types of music or song titles? Can you work out when interest in that genre or song peaks?
Analysing music
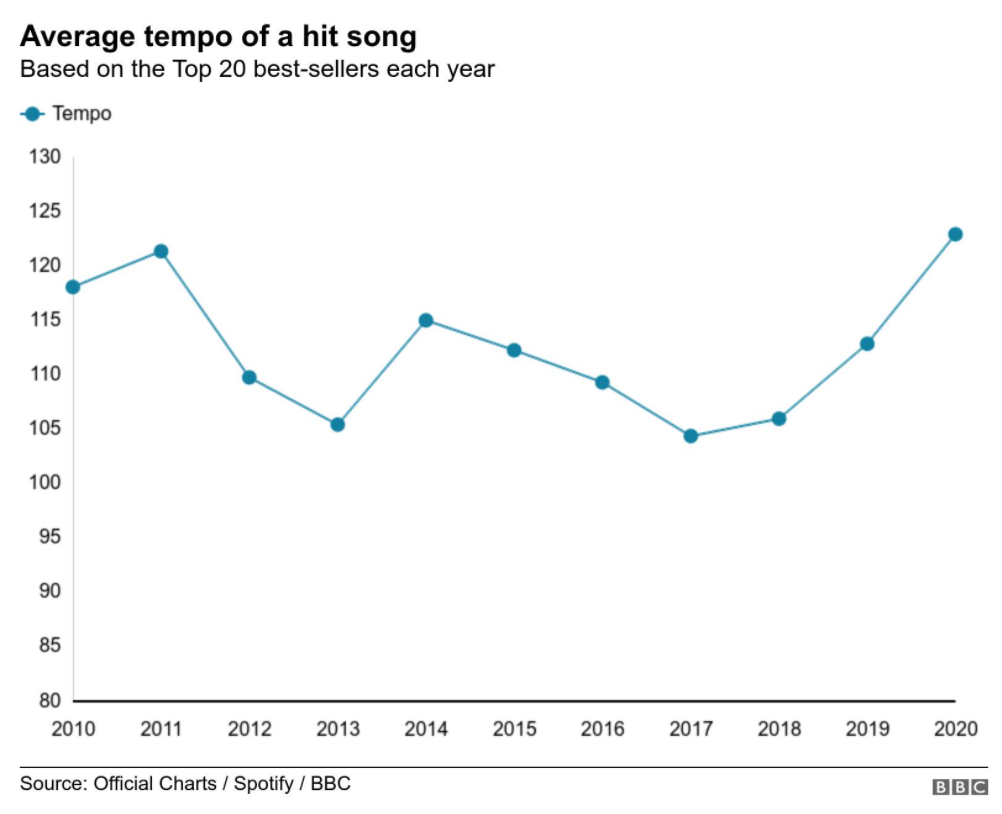
We can use data to analyse music tracks to find out different attributes about the track such as tempo, energy and how ‘happy’ they are!
The BBC found that the average tempo of Top 20 hits are getting faster recently.
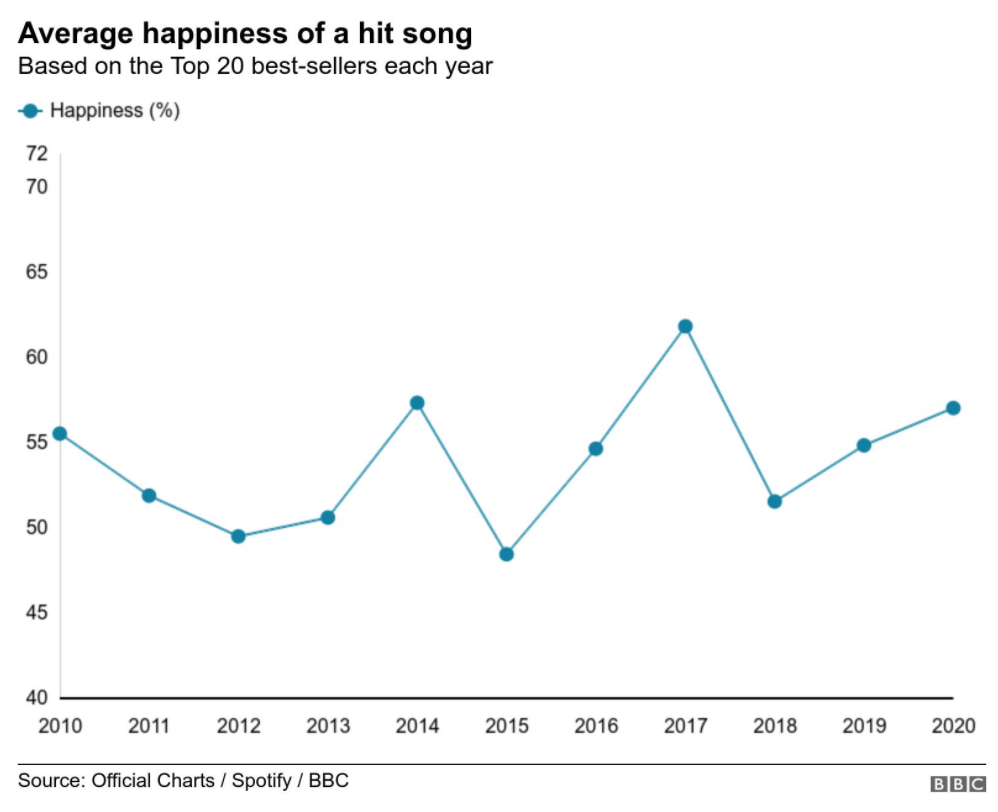
They also found that hit songs are getting happier too.
Can you work out when songs were happiest in the last decade? Can you think of any happy songs from this year?
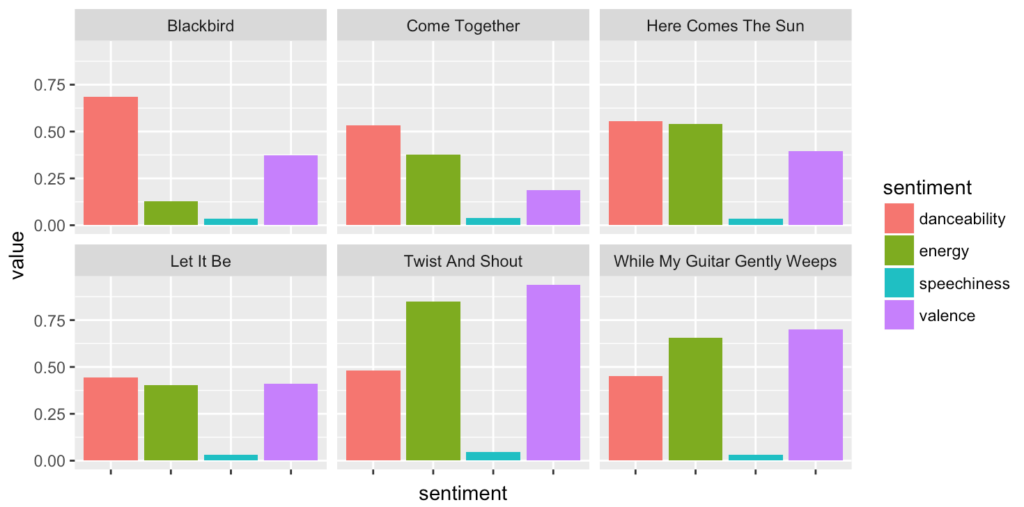
Spotify has information stored about lots of different aspects about music track, including the dancibility, energy, speechiness and valence. Valence is how happy or sad something is. A song with a high valence is a happy song.
Here’s a graph showing these different variables in some Beatles tracks:
Personal music data
You can find out data about your own listening habits too, which might be more interesting if you like music that doesn’t reach the Top 10. If you have a Spotify account, Sort Your Music website lets you arrange your Spotify playlists by different attributes, like tempo, loudness, energy and dancability. You can sort by popularity too, so you can find out just how obscure your musical tastes are!
The same organisation also have Organise Your Music to help you rearrange and tidy your Spotify playlists too, which might be handy if you’ve got a large collection of tracks saved.
Creating music with data
As well as looking at data about music, we can also use data to generate music and sounds. This is called data sonification. For example, we can listen live to Wikipedia edits as they happen.
You can watch and study data visualisations live on Twitch but it’s very quiet data for a such a loud event. Instead, you can listen to the sound of worldwide earthquakes data to get a sense of what the numbers might mean in terms of scale.
Or if you live in San Francisco you can listen to peaceful, calming wind chimes telling you about the local air quality – data about something you normally can’t see.
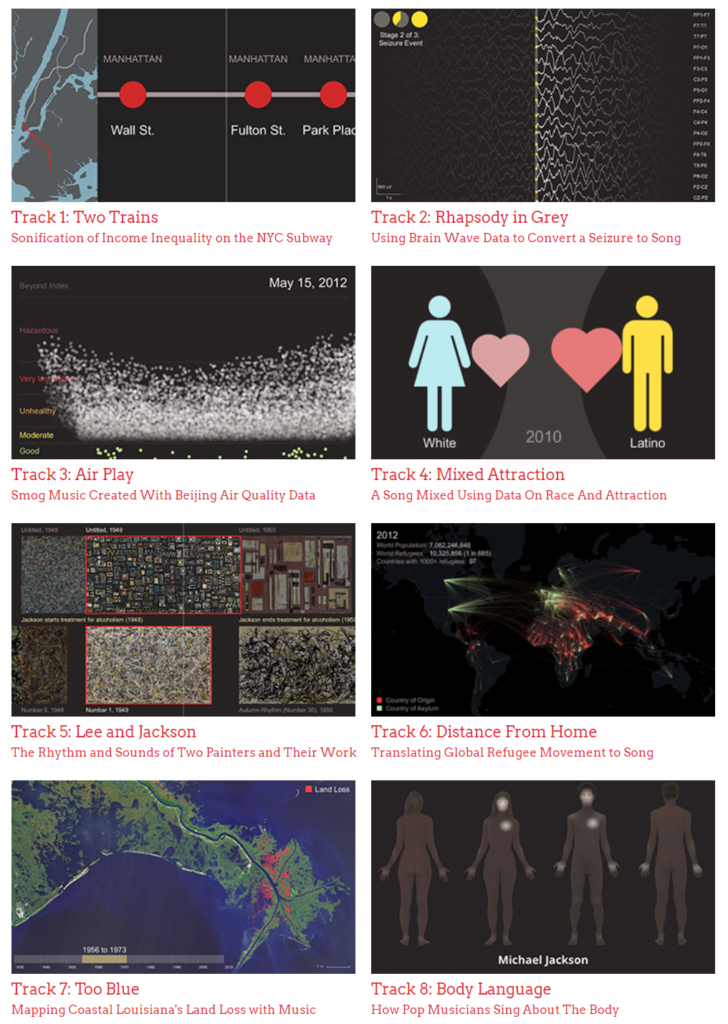
Data Driven DJ has created music tracks based on different sources of data. For example, here’s a song created using gender and race and ethnicity data of actors in blockbuster movies. It lets us hear and see how different groups of people are represented and underrepresented in mainstream Hollywood films.
Using AI to create music
We don’t need to rely on humans to create music either. We can use artificial intelligence to create music. You can train a machine learning model using data from existing music, such as the entire work of Beethoven. The model can then generate new pieces of music in that style.
‘Deep fake’ techniques can be used to generate music too, such as this video that has been created of Bob Dylan singing Britney Spear’s ‘Baby One More Time’ song. There are still huge ethical and legal issues with deep fakes though!
Machine learning recommendation systems are also used to suggest music you might want to listen to next based on the music you like. Companies like Spotify process huge amounts of data on everyone’s listening preferences to suggest tracks. So if you like BTS, you might also like Monsta X because lots of other BTS fans listen to Monsta X too.
Data for the Music Industry
The music industry uses data from streaming services like Spotify to spot up and coming tracks and trends. They use data to decide which tracks to promote next, what type of music to create, and which artists to sign up. In fact, the Scottish postman who recently found fame on TikTok with his sea shanties has just sign up to Polydor music label.
Climate change
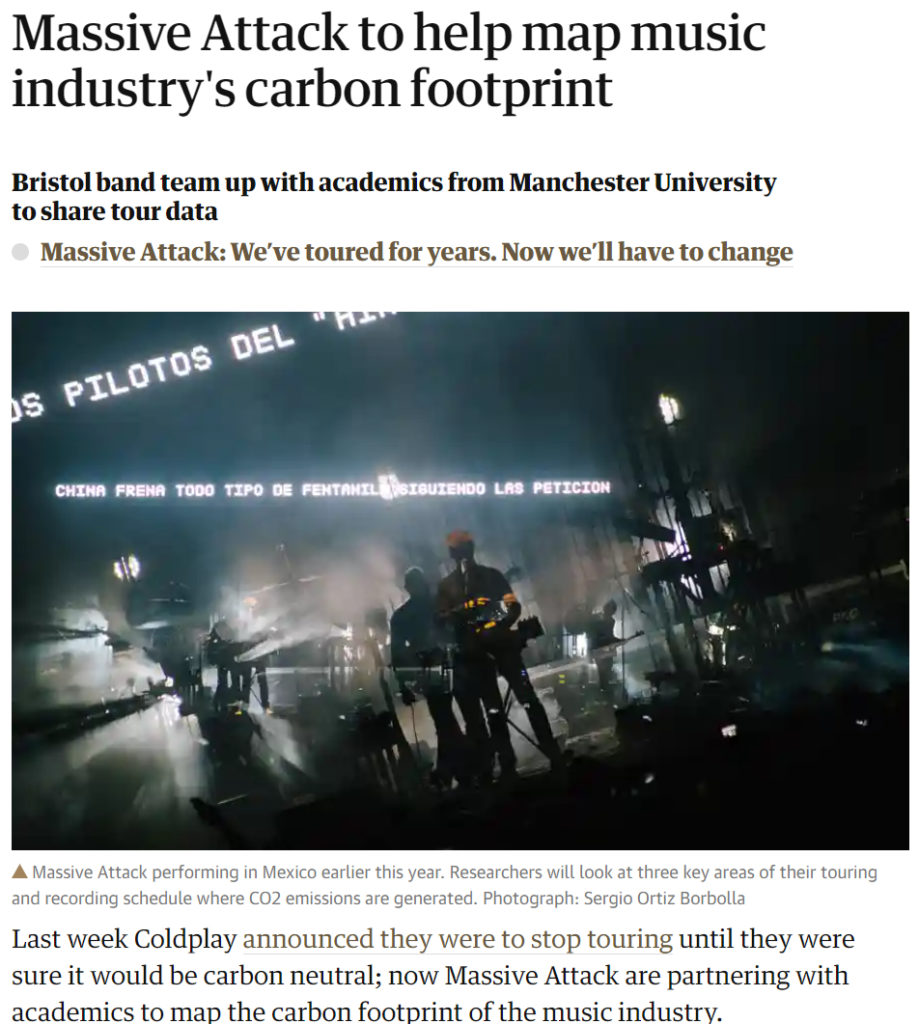
The music industry is starting to use data to look at how to do their part in reducing climate change. Massive Attack are now partnering with academics from the Tyndall Centre for Climate Change to analyse data from their touring and recording schedule to figure out how they can reduce their negative environmental impact.
To explore this further:
- You can explore a range of data sonifications at the Data Sonification Archive.
- Primary school learners can try a data analysis activity using Spotify data
- Secondary school learners can try the Girls in Data Chartmetric music data challenge using Chartmetric data on Billie Eilish social media data
- You can view a collection of music data visualisations created by the Tableau community.
- Investigate the Chartmetric Data Dives
- Find out more about data sonification in ‘Telling stories with Data and Music’.
- You can read more about Google’s NSyth project exploring musical creativity with machine learning.