


Spotify Data Analysis makes use of secondary data from Spotify.
Download activity as PDF or Word
Introduction
Spotify Data Analysis makes use of secondary data from Spotify. Learners will use data to identify patterns and relationships between different characteristics. The activity will support learners in developing their ability to review and interpret a dataset. The activity starts by encouraging learners to think of questions that the dataset might answer and thus develop their “Problem” skills. Once the dataset has been analysed learners will have the opportunity to reorganise and restructure data to help them answer their questions (draw conclusions)
Curriculum Links
This activity can be completed with or without a computer. The curriculum links for both options are shown below.
Curriculum Links for Offline Task
- MTH 1-21a: Using technology and other methods, I can display data simply, clearly and accurately by creating tables, charts and diagrams, using simple labelling and scale.
- MNU 1-20a: I have explored a variety of ways in which data is presented and can ask and answer questions about the information it contains.
- MNU 2-20a: Having discussed the variety of ways and range of media used to present data, I can interpret and draw conclusions from the information displayed, recognising that the presentation may be misleading.
- MTH 2-21a: I can display data in a clear way using a suitable scale, by choosing appropriately from an extended range of tables, charts, diagrams and graphs, making effective use of technology.
Curriculum Links for Online Task
- TCH 1-02a: Using digital technologies responsibly I can access, retrieve and use information to support, enrich or extend learning in different contexts.
- TCH 2-01a: I can extend and enhance my knowledge of digital technologies to collect, analyse ideas, relevant information and organise these in an appropriate way.
- TCH 1-13a: I can explore and comment on processes in the world around me making use of core computational thinking concepts and can organise information in a logical way.
Differentiation
This task can be tailored between first and second level by varying the dataset used.
Pre-Requisites
This activity can be used to introduce learners to elements of PPDAC or to provide a further opportunity to develop their understanding.
Materials
- Spotify data set appropriate to the learners (See Datasets below)
- Paper, pencil
- Coloured paper & coloured pencils (optional)
- Access to spreadsheet software (optional)
- Learner Worksheet Top 20 or Learner Worksheet Top 50
Blended vs Home Learning
This task can be easily split between classroom and home learning if required. The recommended approach is to start the activity at home and and complete it in school.
Datasets
Dataset for first level learners: This data set is a simplified set of information about the most popular songs, containing 20 records and 3 characteristics about each song (artist, genre, popularity) –
Dataset for second level learners: This is the complete dataset for all 50 songs with 11 different characteristics about each song –
Additional Information
New Spotify datasets can be downloaded from Kaggle, however please be aware song titles are typically not censored and songs are often not radio edits therefore may contain words and phrases inappropriate for younger learners.
Knowing how to sort data in Excel can help learners complete this task. Watch this video to learn how to sort your data.
Being able to create a chart in Excel is an optional part of this activity. Read more about how to create a chart
Main Activity
Introduction
Hold a discussion with the group about music. Start with favourite songs and artist and support the group to share their own favourites. Progress to asking what makes a good song and why it might be popular. Finally start to identify characteristics of a song and note them either on a board or encourage the learners to write them on a piece of paper. Characteristics can include.
- Song name
- Artist name
- Genre/Type
- Length
- Rank (popularity)
Exploring the dataset (suitable for home)
This step is focused on the “Problem” step of PPDAC. We are encouraging learners to think about interesting questions about the data they have.
Look through the printable ‘Top 20’ or ‘Top 50’ Spotify songs on the ‘Spotify Analysis’ resource page of the Data Education in Schools website or at the end of this document, or access the data via Kaggle at www.kaggle.com.
What do you notice about the data, what can you find out? Can you think of any questions you would like to know the answer to?
Write down:
- 3 different genres of music in your dataset
- 2 songs with the same popularity score
- The song that will come first and last alphabetically
Organising & Analysing the dataset
This task if focused on the “Analysis” step of PPDAC. We are encouraging learners to review the dataset and identify useful information that may help them understand the questions they thought about in step 1.
If completing this task offline then it can be easier to use the smaller dataset (20 songs) even if the learners are at second level. The task is split into two, one set of questions for each dataset. Worksheets are available for each dataset at the end of this document
Smaller Dataset
Use your dataset to complete the following tasks.
- What is the most popular song?
- What is the least popular song?
- Group the songs by genre
- How many songs are there in the pop category?
- What categories only have 1 song in them?
- Rewrite the table starting at the most popular song and ending with the least popular song.
Larger Dataset
Use your dataset to complete the following tasks.
- What is the most popular song?
- What is the least popular song?
- Group the songs by genre
- How many songs are there in the pop category?
- What categories only have 1 song in them?
- Which song is the best to dance to?
- Which artist sings the song with the most beats per minute?
- Identify 3 artists with more than one song in the dataset
The above tasks can be made easier if the data is sorted in Excel (or similar spreadsheet package). Teachers or Parents can encourage children to learn how to sort the data by following the instructions here: https://youtu.be/KS9N4yAjuYQ
Visualise your dataset
This task mixes the “Analysis” and “Conclusions” part of PPDAC (Problem, Plan, Data, Analysis, Conclusion) cycle. Creating a summary table continues the analysis phase and seeks to show how a large amount of data can be presented in a different way. Visualising the data can support both analysis and drawing conclusions. Learners should be encouraged to connect questions they asked at the start to the analysis they are doing the information they can extract from the visualisation.
We are now going to learn to create a visual representation of the data. Again this can be done with or without a computer.
Smaller Dataset
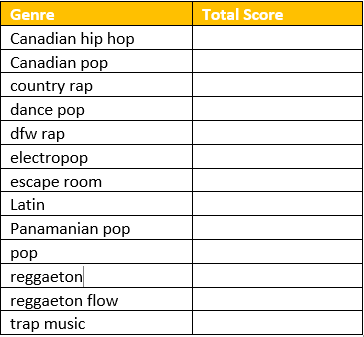
- Add up the total score for each genre of music. Complete this table.
- Create a bar chart of genre and total score. The chart can be created in a variety if different ways.
- Draw it on paper
- Use Lego, or similar blocks to create it on a table
- Use sticks and other natural materials to create it outside
- Use excel to create a chart in your spreadsheet.
The group can have an optional discussion about whether the highest scoring genre is therefore the most popular. This is an opportunity consider the ideas behind averages. Learners could be asked to:
- Review what are the 3 most popular songs, are these in the most popular genre?
- What might cause the most popular genre to be different to the genre of the most popular song?
Larger Dataset
The following tasks are more suited to using a spreadsheet.
- Create a table with 4 columns, Genre, number of songs, Total Popularity Score and average score
- Fill in your table
- Put each genre in the first column
- Find out how many songs are in each genre and enter it in column 2
- Add up total popularity score for each genre and enter it in column 3
- Calculate the average score by dividing the total popularity score by the number of songs and enter it in column 4
- Create a bar chart of genre and average score in your spreadsheet software
Follow on work and subject extensions
- Expressive Arts – Music Choreograph short dances to music with different beats per minute
- Numeracy & Technologies- Create a top 50 songs for your class or school
- Expressive Arts – Create a piece of art that represents one of the songs in the dataset using only the characteristics available in the dataset
© Data Education in Schools, University of Edinburgh, 2024. This resource is licensed CC BY-NC 4.0, unless otherwise indicated.