


Download this resource in PDF or Word
Download a set of PowerPoint slides for use in class
Introduction
The Scottish Witch Trials covered a 200 year period between 1550 and 1750. This resource uses the witch trials as the context to develop learners’ data literacy skills and to introduce the idea of a database.
The Survey of Scottish Witchcraft Database is used as the primary data source. Learners will search the database and use different maps to follow the stories of different people involved in the trials.
Copyright & Data Access
All data and map screenshots used in this resource are copyright to : Julian Goodare, Lauren Martin, Joyce Miller and Louise Yeoman, ‘The Survey of Scottish Witchcraft’, www.shc.ed.ac.uk/witches/
Curriculum Links
Outcomes to support data skills
- TCH 3-02a: Having used digital technologies to search, access and retrieve information I can justify my selection in terms of validity, reliability and have an awareness of plagiarism.
- MTH 3-21a: I can display data in a clear way using a suitable scale, by choosing appropriately from an extended range of tables, charts, diagrams and graphs, making effective use of technology.
- LIT 3-06a: I can independently select ideas and relevant information for different purposes, organise essential information or ideas and any supporting detail in a logical order, and use suitable vocabulary to communicate effectively with my audience.
- SOC 3-01a: I can use my knowledge of a historical period to interpret the evidence and present an informed view.
Topic Introduction – Gellis Duncan
Watch a 6 minute (BBC) clip about Gellis (Gelie) Duncan:
The Scottish Witchcraft Database
Talk to the class about the database and provide context to the project.
Explain that we are going to use this database to both learn more about what a database is and how it works and to find out more about witches and an interesting period of Scottish History.
Activity 1 – Witchcraft in Scotland
- Read the database introduction
- Find out the following:
- How many accused witches were women and how many were men?
- What was the average age of most of the accused witches?
- What was the name of the law that was used to prosecute accused witches?
- Write down one other thing you found interesting
Hold a plenary to review the findings
The following layout diagram can be used to help learners understand the relationships between the data and to explain how the information has been structured. The diagram is copyright of the Scottish Witchcraft Survey.
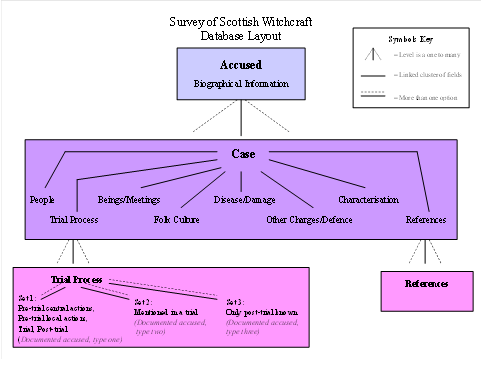
Things to consider
- There is a 1:n relationship between accused and case, therefore an accused witch could be involved in more than one case.
- There is a 1:n relationship between a case and a trial process so a case may form part of more than one trial process.
The following activities will help learners become familiar with the architecture of the database.
Activity 2 – Find out more about Gellis Duncan
Use the Scottish Witchcraft Database and read more about the Gelie Duncan case (note the alternative spelling of her name).
Encourage learners to follow the links in the database and make notes about what they find. In addition look at the information about Gelie Duncan and the Database layout diagram and do the following:
- Identify biographical data about Gelie Duncan. Using this information could you update the database diagram to provide more details of the different data stored about an accused witch?
- Identify case data for Gelie Duncan, how many different examples of case data are noted in Gelie Duncan’s record?
- Identify Trial Process Data about Gelie Duncan. Which sets of data are shown in her record?
Hold a short plenary sharing information. Did the diagram help understand the data? How did they identify related data? What more we might want to know?
Activity 3 – Mapping Data
Use Scottish Witchcraft Maps to understand more about Scotland’s witches. Find out:
- How many witches lived in your town?
- Look at the map. What do you notice about where the witches lived? Are there more witches in some places than others?
Work in small groups, using two devices.
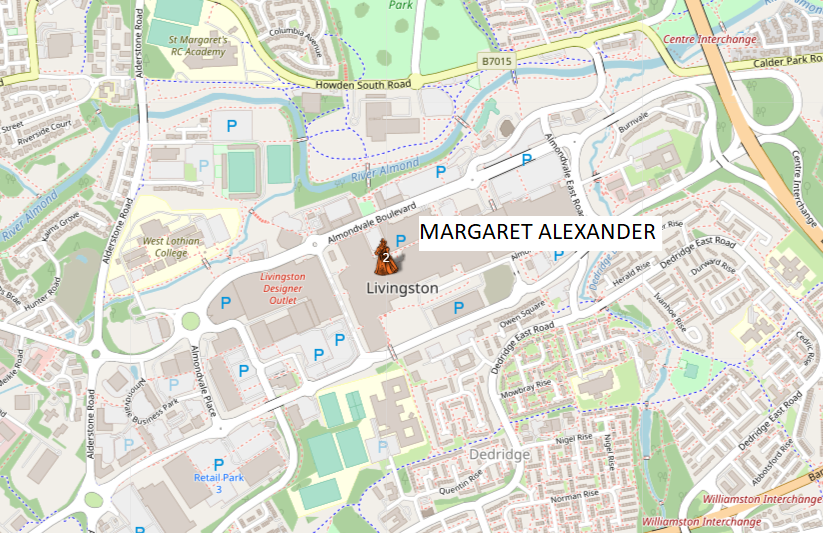
- Use both devices and find Margaret Alexander on the map, you will find her in Livingston, a bit to the left of Edinburgh.
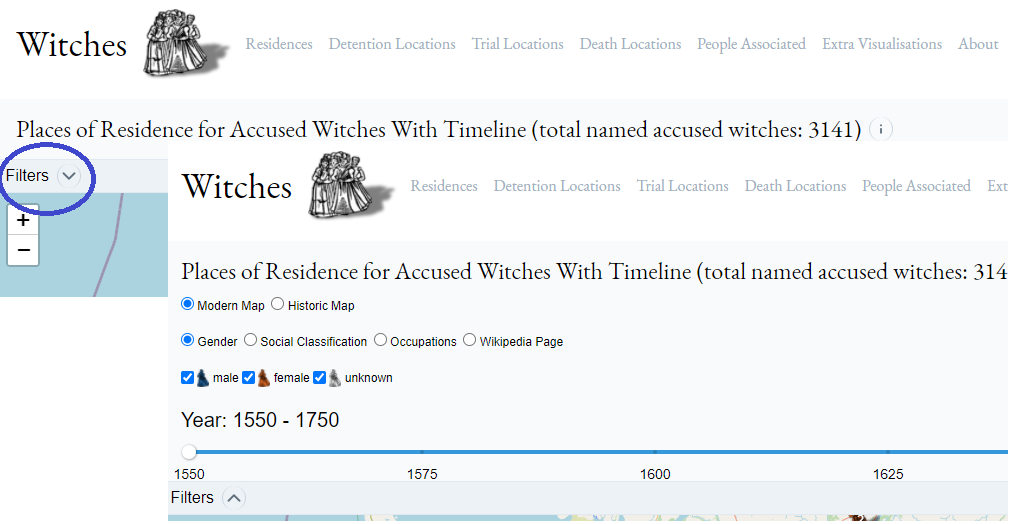
- On one device, open the filter section and change the map to Historic map. This will display a map of the same place from 1917.
-
-
- Compare the two maps.
- How can you tell both maps are of the same place?
- What differences can you see between the two maps?
- How could these differences have impacted the ability to show the witches on the map?
- Compare the two maps.
-
This activity can be extended by using a map from 1853.
Activity 4 – Data over Time
- Use the timeline map. Use the filter to show different ways you can view the data.
- Which time period had the most trials? (each 25 year block)
- What happened to the number of witch trials over time?
- Explore the impact of social class. Were there lots of rich accused witches or were they more likely to be poor?
- Use the filter to find a witch that has a Wikipedia page. Make notes on your chosen witch and be ready to explain to the class.
Activity 5 – Searching and Organising Data
Use the search function in the Scottish Witchcraft Database to research the stories of the following witches. Select between 3 and 5 items of data and create a summary table of information. Think about how you might organise your table, would you list the information by witch name? Perhaps you might use time and display information from the earliest to the newest. Can you think of other ways to display the information?
- Issobell More McKaw
- Donald McIllmichall
- Isobel Cockie
- Andro Man
- Jonat Leisk
- Janet McGowan
- Elspeth Cuninghame
- Catharin Mactargett
By clicking on the “Cases Involving the Accused” you can find out what kind of witchcraft the person was accused of. Talk to your group about what the witch was accused of. Does it sound like witchcraft? Can you think of another way of interpreting what happened?
Activity 6 – Using data to tell a story
Use the glossary to look up the following terms and develop your understanding of the witch hunters:
- Witch Pricker
- Devil’s Mark
Learn more about the Witch Hunters by following the story of John Kincaid. Start by looking him up. What can you find out?
Now use the interactive map to follow his story.
This is an open ended task with no specific questions. Instead, the goal is for learners to explore the stories noted in the map and use the database to search for people, places, trials etc.
At the end, each group could be asked to talk about something they found interesting or surprising. They should be encouraged to discuss how data was used to tell a story. Did they find it interesting? Compare it to reading this page about John Kincaid.
Which way of presenting the information did learners prefer and why?
The goal here is to show that the same data can be presented in different ways and the choices made on how data is presented can impact people’s enjoyment, their understanding and their interest in a topic.
Follow up Activities
Computing and technologies activities:
- Work in groups. Pick a topic of interest (Avengers films, football, bands/popstars) create an example database layout for information gathered about the selected topic.
Social Studies:
- Consider the impact of witchcraft on women and the misogyny behind the allegations
- Consider the role of rumour and accusations on people, how this might relate to modern life; for example allegations made on social media.
Numeracy:
- Use an extract of the database to support information handling activities such as drawing graphs and tabulating information.
Note: Download the complete database (subject to copyright agreement). A version of Microsoft Access 2007 or earlier is required to open the file. If you cannot open the file please contact dataschools@ed.ac.uk for an extract in Microsoft Excel format.
© Data Education in Schools, University of Edinburgh, 2024. This resource is licensed CC BY-NC 4.0, unless otherwise indicated.