


Download this activity in PDF or Word
Introduction
This activity provides data learning opportunities for classes reading ‘The Boy At The Back Of The Class’ by Onjali Q. Raúf.
Teacher experience
In this clip, primary teacher Julie Horsburgh shares her class’s experience with reading The Boy at the Back of the Class, which offers a child’s perspective on the refugee crisis. Building on an idea shared in one of our Data Literacy Professional Learning sessions, the class creates data cards for characters in the story. Pupils mapped data in the book so that they could better understand the distances that characters had travelled.
Materials:
- Copy of Boy at the Back of the Class by Onjali Q. Raúf
- Access to the internet
- Access to a spreadsheet tool (optional)
Curriculum Links
This resource can support delivering the following experiences and outcomes. Specific alignment will vary depending on which elements of the resource are used in the classroom.
- SOC 2-15a: I can use evidence selectively to research current social, political or economic issues.
- TCH 2-02a: I can use digital technologies to search, access and retrieve information and are aware that not all of this information will be credible.
- TCH 2-01a: I can extend and enhance my knowledge of digital technologies to collect, analyse ideas, relevant information and organise these in an appropriate way.
- TCH 2-11a: I can use a range of graphic techniques, manually and digitally, to communicate ideas, concepts or products, experimenting with the use of shape, colour and texture to enhance my work.
- MNU 2-20a: Having discussed the variety of ways and range of media used to present data, I can interpret and draw conclusions from the information displayed, recognising that the presentation may be misleading.
- MNU 2-21a: I can display data in a clear way using a suitable scale, by choosing appropriately from an extended range of tables, charts, diagrams and graphs, making effective use of technology.
Inclusion
Before using this activity consider your class, are there any refugees in the class? Are there learners who may have family members who were refugees or who have had to leave their home country due to persecution, social unrest or other challenging circumstances? It can also be worth consider other learners within the school and the wider community of your setting to ensure that discussion of the topics within the book and this resource do not inadvertently upset or in any other way make a young person feel uncomfortable.
Pre-Requisites
It can be helpful for learners to have some awareness that large international organisations are trying to help refugees. This might include the United Nations High Commissioner for Refugees (UNHCR) and The Red Cross & Red Crescent Society.
Lastly it can also be helpful to have learners think about what help refugees might need, such as housing, food, health care and education. This can provide a great way to introduce the UN Charter on Human Rights.
Helpful Vocabulary
Learners would benefit from having an age appropriate understanding of the following vocabulary before taking part in this activity.
- Refugee
- Asylum
- Displaced person
- Stateless Person
Creating a Data Driven Activity
This resource provides a range of links and ideas to access data about refugees. The resource can be used in two ways – development of data/information handling skills and/or a route to introducing (or further developing) learners’ understanding of Data Science and the ability to apply the PPDAC Data Problem Solving Cycle.
Below you will find some examples about how to apply PPDAC to ‘The Boy at the Back of the Class’ and a greater understanding of Refugees.
Problem
- Ask the class to think about refugees, what do they understand about refugees just now? What would they like to know? Work as a class or in small groups to develop questions, note on the board and select or take a vote and decide on 1 or 2 questions to continue working with.
- Some example questions which the data can help learners answer include:
- Where do refugees come from?
- Where do refugees go?
- How many children are refugees?
- What is the difference in the number of refugees this year and last year?
- How long are refugees called refugees?
- Which country has the most refugees?
- Other questions learners might ask but which would benefit from being rephrased are:
- Are there more refugees now than when I was little (or some other point in the past)?
- Do all refugees come from country x?
Broadly speaking the teacher should support learners to identify questions that have quantifiable answers rather than yes/no answers.
Plan
Having selected one or two questions for the class to answer, encourage learners to think about what data they might need to find to help their question and how they might find this data. Example data might include:
- Country populations
- Maps of different countries
- Information on routes taken by refugees
- Numbers of refugees from different countries
Example places to find the data might include:
- News articles
- Google searches
- Wikipedia (or similar site)
This element of PPDAC will likely be easier if learners have been introduced to the UNHCR and the idea that there are organisations helping refugees. Teachers can help learners to understand that some of these organisation might collect information about refugees so that they can help them.
Data
This step of PPDAC is there for learners start to find and explore the data. The information below, in the Using Data – Learning more about Refugees section, provides more information about the data available and the kinds of questions learners can ask.
The data step is not only about identifying and collecting suitable data. It is also provides an opportunity to consider ideas around how data is presented and if we think it is credible. Teachers can support learners to think about how the media is presenting data, perhaps comparing two contrasting new stories about refugees and asking how we can assess which is correct.
Analysis
During the analysis phase learners should be supported to make sense of the data. Teachers can support this activity by asking simple questions like finding the maximum value of one characteristic or finding ways to summarise the data they have found. Learners might be asked to convert a table of information to a chart or a chart to a table. Over the course of BGE (Broad General Education) learners should be developing their skills in understanding and interpreting tables, charts, graphs and other data representations.
Conclusions
The conclusions step requires learners to answer their questions from the “problem” step by using the data they have analysed in the “analysis” step. There are numerous ways to present conclusions:
- Verbally, sometimes there is a simple answer
- Drawing (paper or in a suitable software package) a summary chart or graph
- A presentation: answers to the question could be combined with information about the wider context (e.g. in this case a presentation about Syria that discusses where it is on a map, explains that there has been a civil war and then data about refugees that answer the questions.
- Class displays or posters
- Video
- Animation
Background Activities
The following activities help learners find out more about Syria, and Ahmet’s journey. The aim is to provide wider context to the book and prepare the learners to start thinking about finding out more about refugees. These activities focus on information/data handling.
Learning more about Syria (Mapping & Routes)
Use a map tool such as Google Maps, Google Earth or openstreetmap.org to find Syria, the country where Ahmet grew up. Look at the map of the world with Europe in the centre. Do the learners have any idea where Syria might be on the map? Navigate around and see if you can spot it.
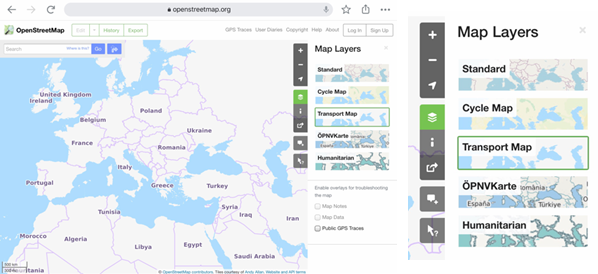
If you use Open Street Map you may need to change the ‘layer’ to one that shows country names in English.
Enter ‘Syria’ into the search bar. Are there any countries nearby that learners recognise?
Have any of the learners gone on holiday to Turkey, Greece or Egypt? Have they heard of the names of nearby countries from the news?
How far away is Syria?
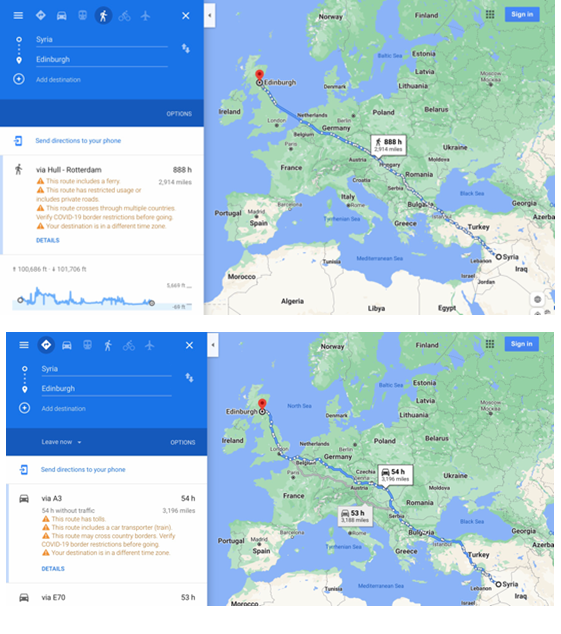
Use the Directions feature of Google Maps and answer the following questions:
- How many miles away is Syria?
- How many hours would it take to drive from Syria to your school?
- How many hours would it take to walk?
- How many countries would Ahmet and his family travel through?
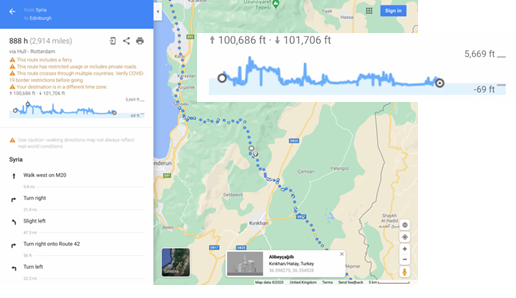
Ahmet wouldn’t have come the most direct route. Can you find any clues in the story about some of the difficulties they faced?
Google Maps shows how high the journey climbs. Look at the graph and find points where Ahmet and his family would have had to climb quite high. What do you think the toughest points would have been? (Can you find those on the map?)
Can you map a journey and compare it to Ahmet’s journey?
Using Data – Learning more about Refugees
The following activities can be used stand alone or as part of the PPDAC data problem solving cycle outlined above.
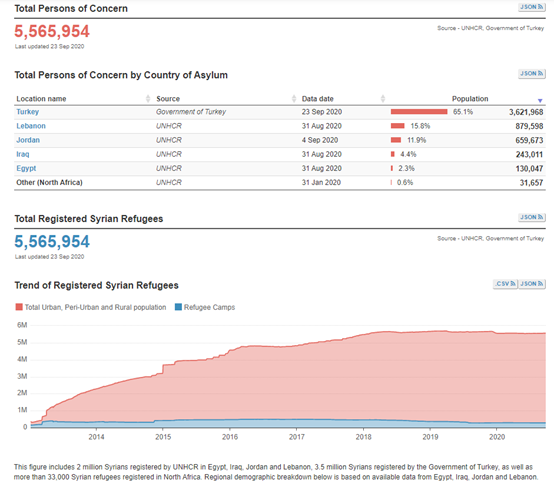
The United Nations High Commissioner for Refugees (UNHCR) is the part of the United Nations that aims to help and protect refugees.
Use their website to learn more about how many refugees leave their home countries and where they travel to. Learn more about Ahmet’s home country of Syria.
Answer the following questions:
- How many refugees are there from Syria?
- Which countries do most Syrian refugees travel to?
Beyond Syria
Find out more about the global refugee situation using www.unhcr.org/refugee-statistics. This site can be used in different ways depending on your learners.
- Use the key indicators page only and explore each of the different measures.
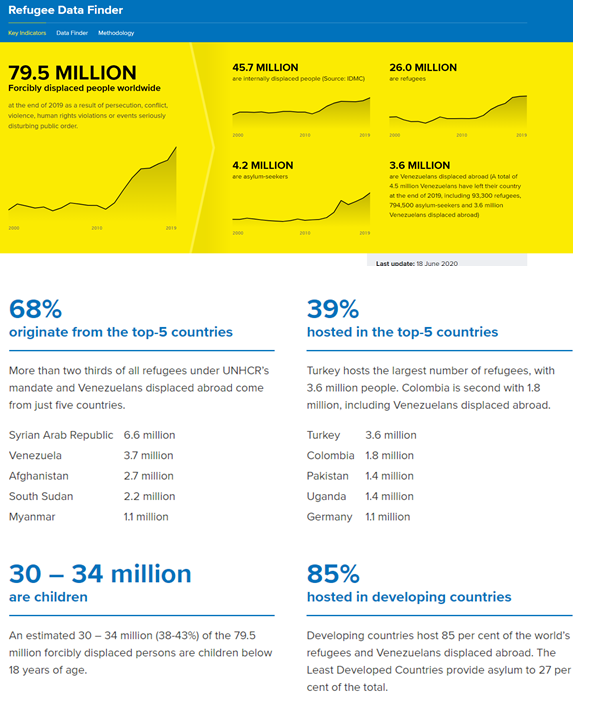
Use the data finder to explore data and answer learner questions. The site is not as user friendly as those used above so some specific questions and links are noted below:
Review the displaced and stateless populations data and find out:
- Is the number of refugees increasing or decreasing? Can you suggest reasons for your answer?
- Do all refugees claim asylum?
Review the displaced and stateless population gender data and find out
- How many refugees are a similar age to you? Compare the number to a measure that might mean something to learners for example population of your city, number of children in their school or local area
Followup Activities
- UNHCR Teaching Packs with a range of cross curricular activities
- Refugee camps: A map of refugee camps around the world Can you find the refugee camps that might have people from Syria?
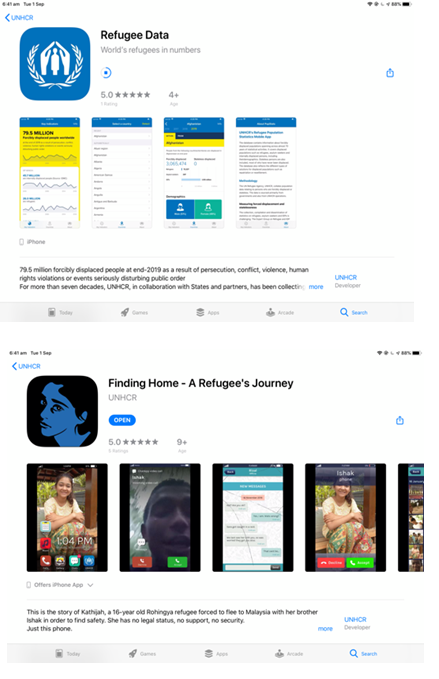
- Using Apps: UNHCR have two free apps available for iOS and Android that might be of interest. They have a Refugee Data app that shows the data from their website, and a Finding Home simulation telling the story of a 16 year old refugee in video clips.
© Data Education in Schools, University of Edinburgh, 2024. This resource is licensed CC BY-NC 4.0, unless otherwise indicated.