


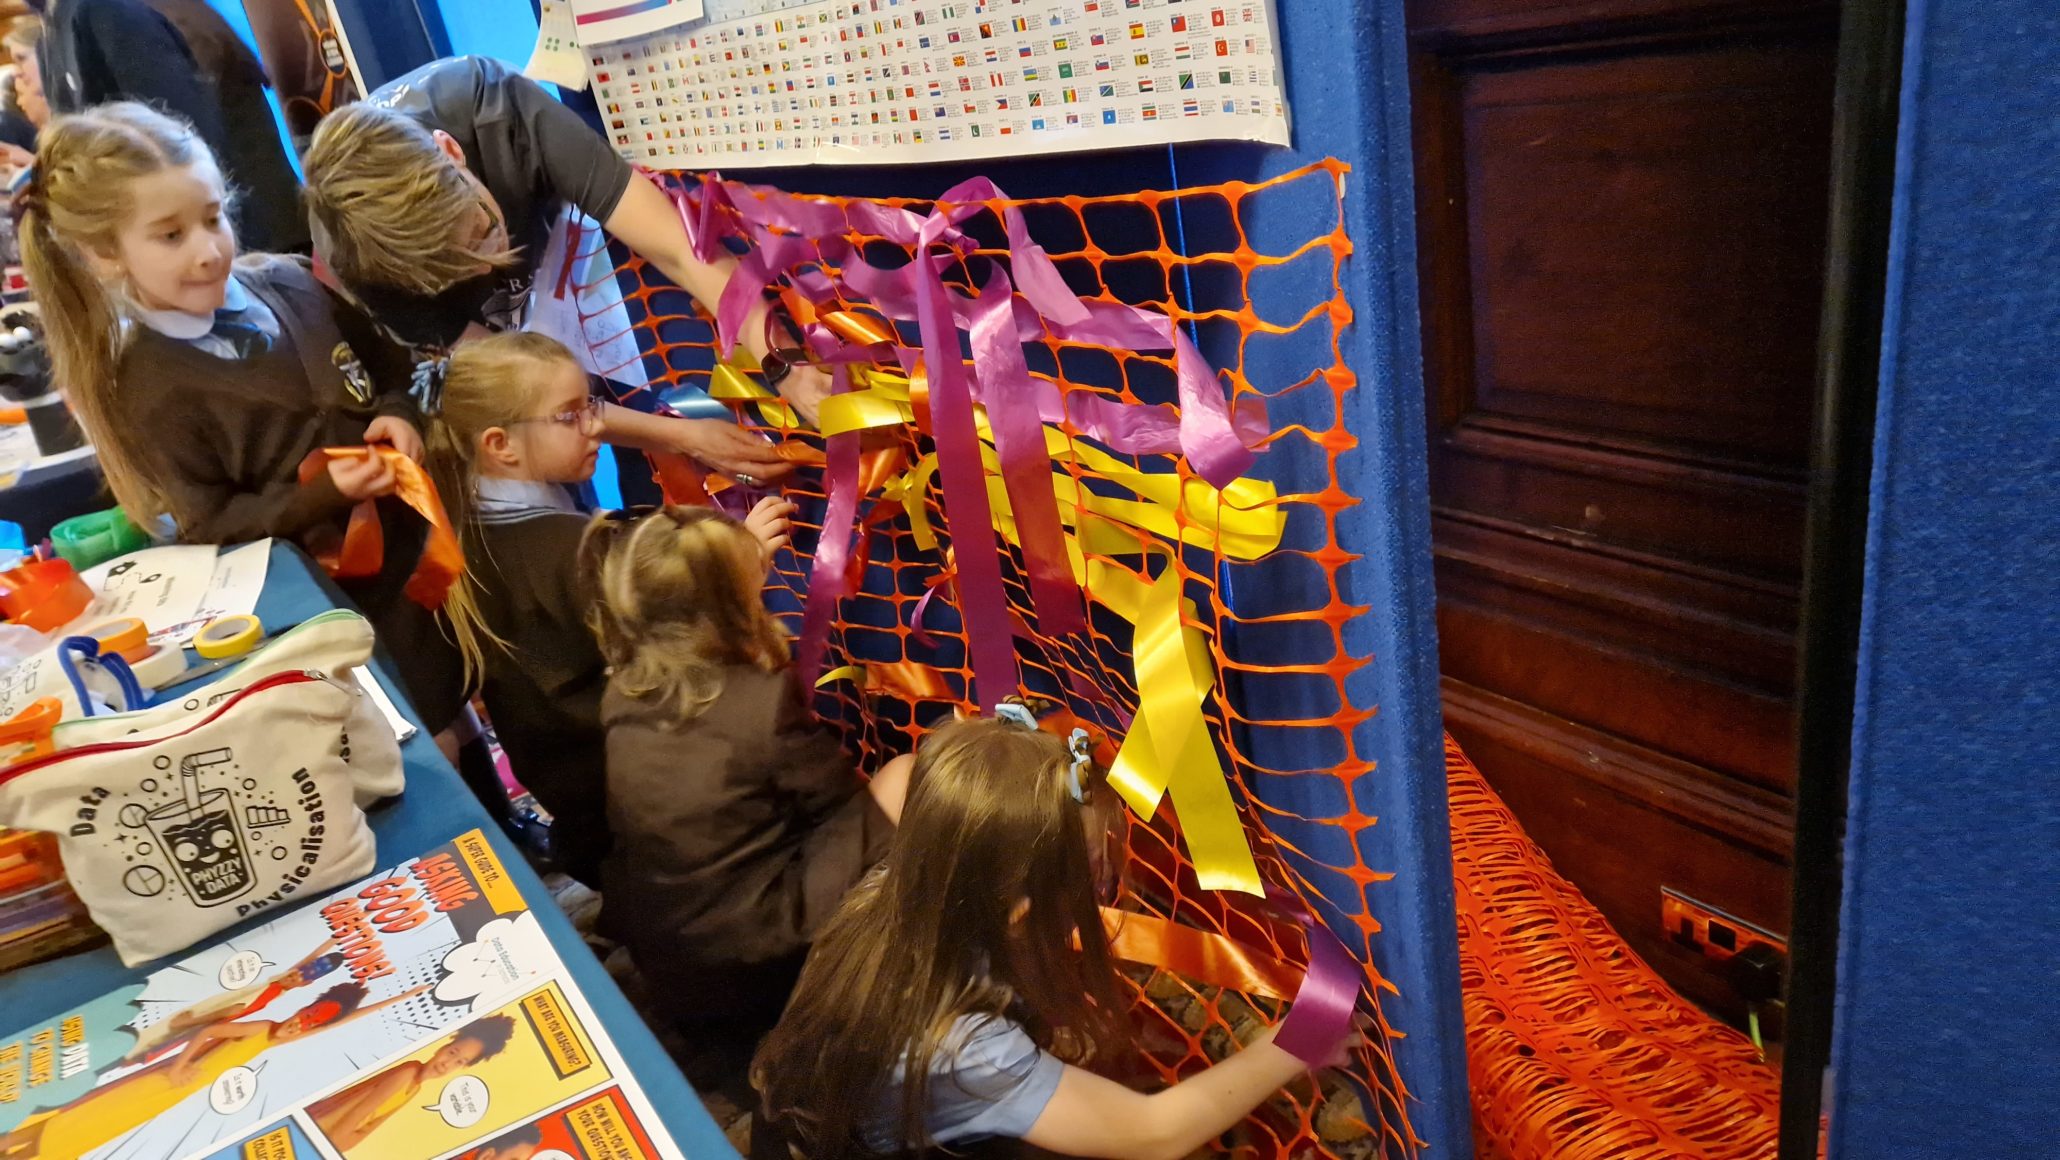
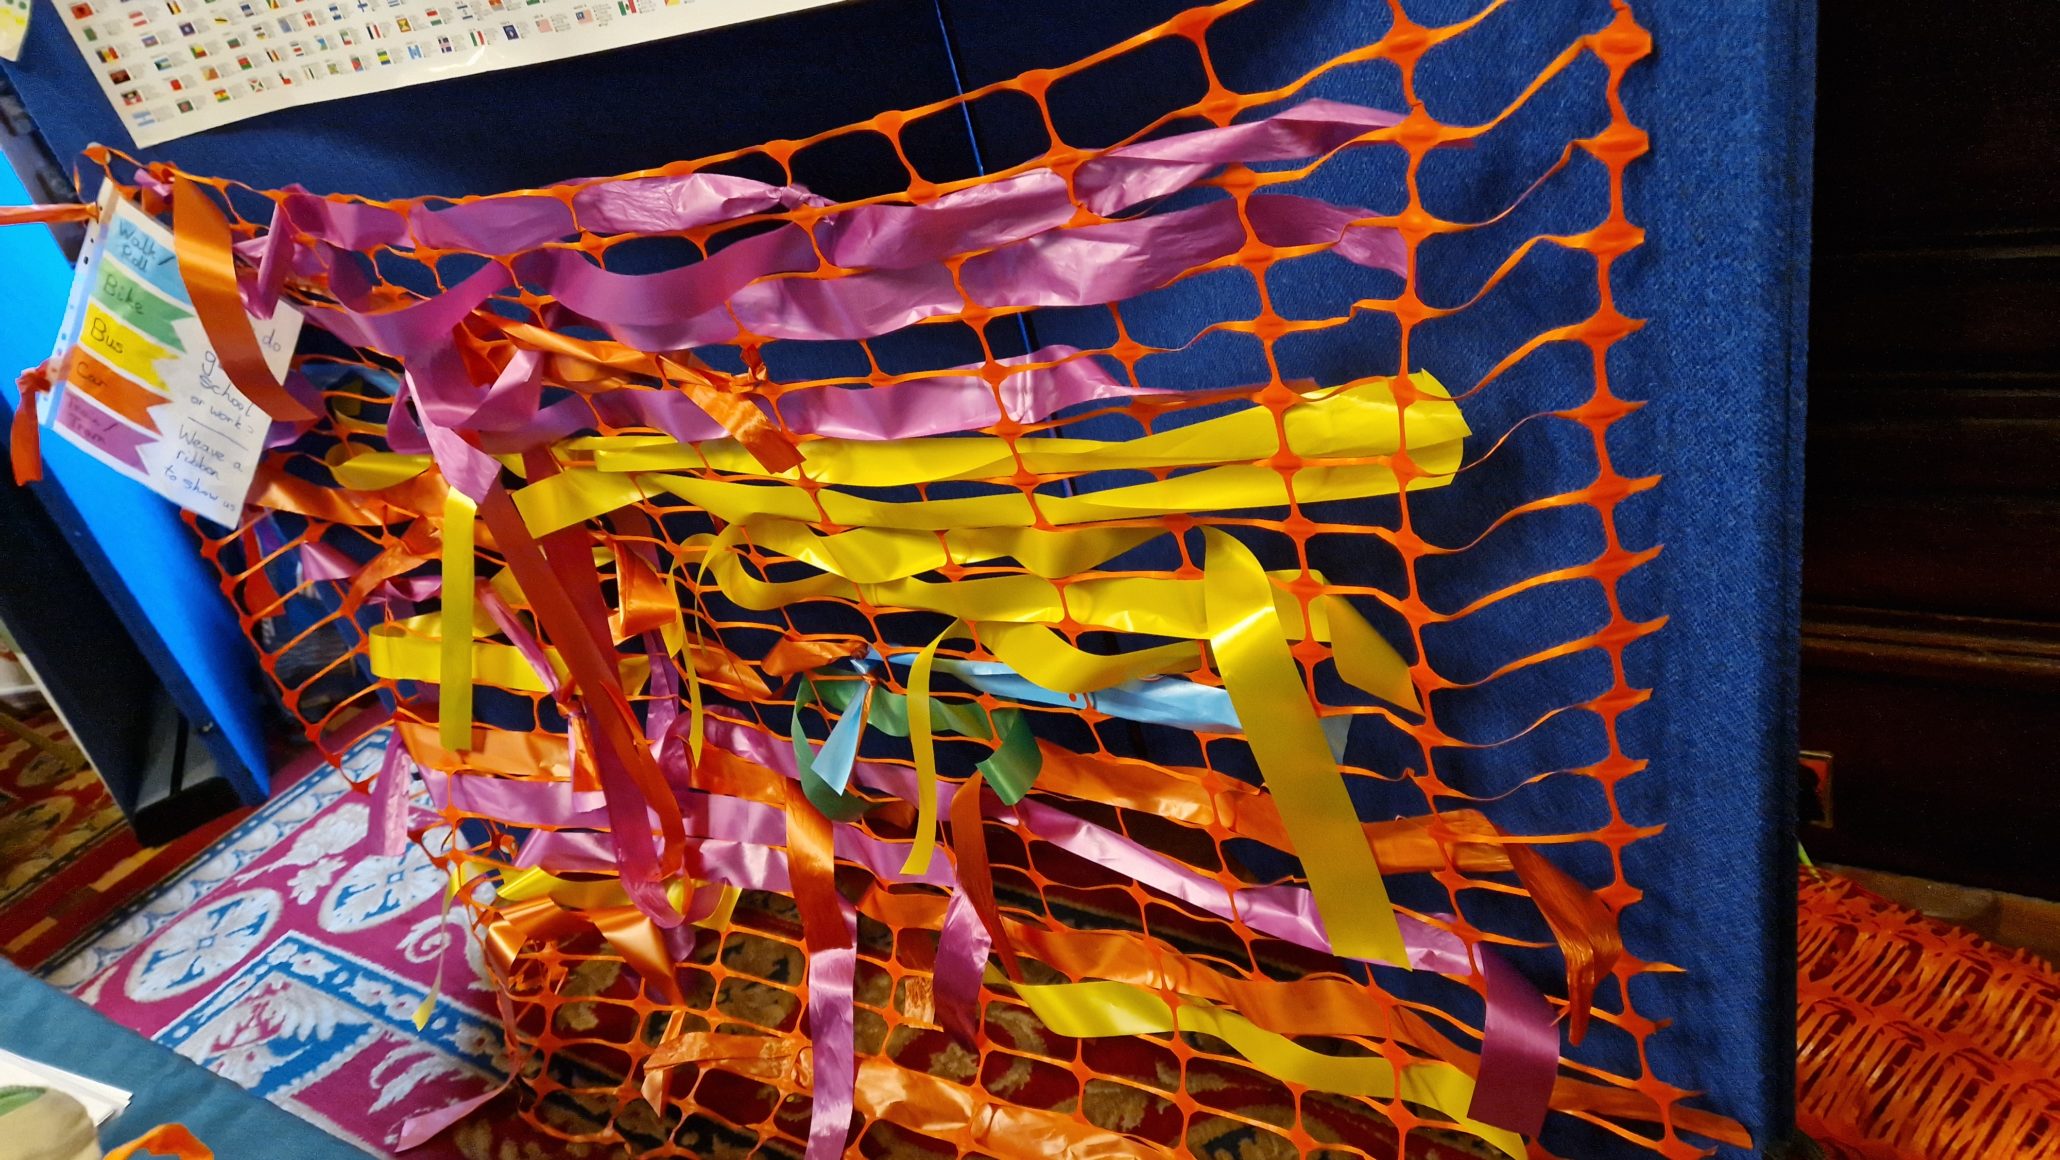
In this award-winning, unplugged activity, learners use strips of material woven into a fence or other large frame to display data, creating a collaborative art installation that is both eye-catching and conversation-sparking.
Step 1: Materials
Something to weave with: You can use ribbon, yarn, or cut strips of recycled fabric (see this recycled fabric video for example) for the weaving material. You will need as many different colours as the number of categories in the data you are collecting.
Somewhere to weave on: You could use a fence in the school playground, a climbing frame or trim trail, furniture, or stick netting onto a classroom wall, like in the images below.
Step 2: Data
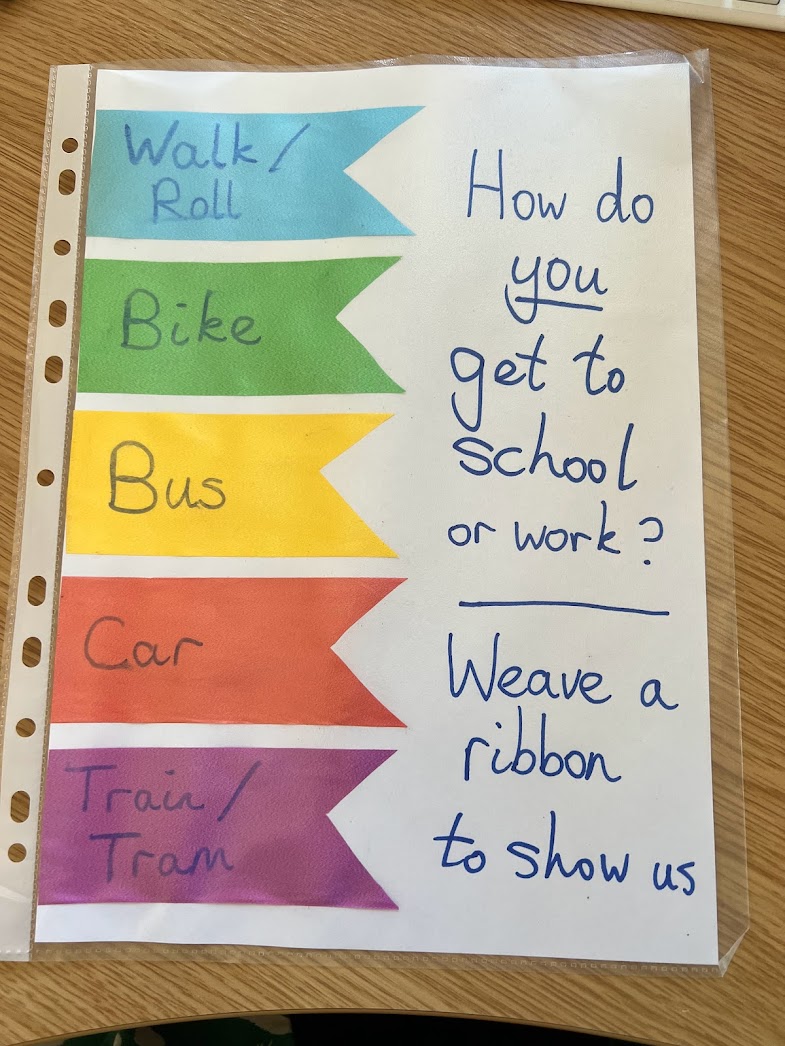
We have previously used this activity to collect data on how learners or teachers usually travel to school, but you can also choose your own question to investigate! It helps to collect categorical data, so that each category can be represented by a different colour of ribbon, and to provide a key (see image below).
Step 3: Weave your data and discuss the results!
In our travelling-to-school topic, you can ask questions like “What is the most common mode of transport for getting to our school?”, “Why do we think most people travel by car/bus/walk (delete as appropriate)? “Is this mode of transport sustainable?”, “What could we do to encourage more sustainable travel to our school?”. You could also compare two schools (urban versus rural? primary versus secondary?) or run the activity across a cluster.
Further Information
You might be interested in a data representation made with weaving in the Edinburgh Futures Institute. This art installation was created in honour of Edinburgh’s first female medical students.
© Data Education in Schools, University of Edinburgh, 2024. This resource is licensed CC BY-NC 4.0, unless otherwise indicated.