


Download this activity in PDF or Word
Introduction
Climates, Microclimates & Temperature Data has 3 learning outcomes;
- understand the differences between and be able to define climate and microclimate
- understand the differences between and be able to define dependant variable and independent variable
- learn to measure temperature and recognise factors (dependant variables) that impact temperature
Pre-Requisites
Sessions 3 and 4 assume that learners have been introduced to PPDAC – The Data Problem Solving Cycle.
Curriculum Links
- SOC 1-07a: I can describe and recreate the characteristics of my local environment by exploring the features of the landscape.
- SOC 1-12a: By using a range of instruments, I can measure and record the weather and can discuss how weather affects my life.
- MNU 1-20a: I have explored a variety of ways in which data is presented and can ask and answer questions about the information it contains.
- MNU 1-20b: I have used a range of ways to collect information and can sort it in a logical, organised and imaginative way using my own and others’ criteria.
- MTH 1-21a: Using technology and other methods, I can display data simply, clearly and accurately by creating tables, charts and diagrams, using simple labelling and scale.
Materials
This activity uses the following materials
- Pen/Pencil/Paper
- Coloured pens/pencils
- Thermometer (1 between 4)
- Picture of the classroom (optional)
- Spreadsheet tool (optional)
Duration
- 3 to 4 sessions of 1 hour each
Session 1: Climates and Microclimates
Start with a class conversation about climate. What do learners understand climate to mean? What different types of climate do they know about? How does climate vary across the world?
Complete a short activity that helps learners match weather conditions to climate names. The correct definitions are shown below. This activity could be done in several ways:
- Ask learners to copy the terms and draw lines from the climate type to the weather conditions
- Pick a climate type and draw a picture
- Class Game: Assign 6 learners to be climates and give them a definition of their climate type. The rest of the class has to ask yes/no questions and have to decide which climate type each of the group of 6 learners is representing. This can be a good problem solving and lateral thinking task.
- Polar: Very cold all year round
- Temperate: Cold winters, mild summers
- Arid: Dry and hot all year round
- Tropical: Hot and wet all year
- Mediterranean: Mild winters, hot summers
- Mountainous: Dry and cool all year
Consider the local area around the school. What climate do the class think they live in and why? What features of our climate can they identify to justify their answer.
Microclimate
Move the discussion forward by asking learners to now think about what a microclimate might be and where we might find one.
- A microclimate is a climate of a small space which is different from the climate around it.
- Your classroom is a microclimate which is different from the climate outside.
- Can you think of another example of a microclimate?
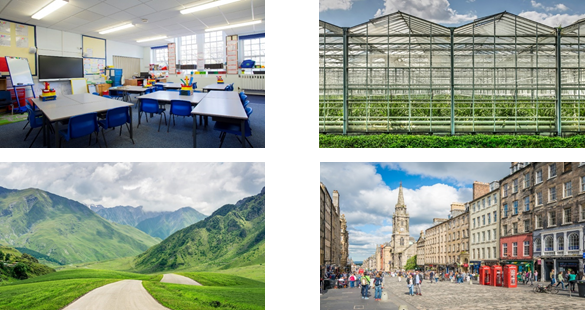
The following pictures can be displayed and the learners asked whether they think it is a climate or microclimate. Have a discussion on the differences between a climate and microclimate ensuring learners understand that a microclimate defines the climate in a small enclosed area.
Design your own Microclimate
Working in small groups, learners design their own microclimate. They should consider:
- Where is the microclimate?
- Do the conditions vary over time/seasons?
- What are the main characteristics of their microclimate (temperature, wind, rain etc)?
- Would they like to live in this microclimate? If so why? Who else might live there?
At the end the session learners share their microclimate design and talk through their ideas.
Session 2 – Variables & Sensors
A variable is a word used in science to describe something which can be changed. There are 2 main types of variables: independent and dependent.
- Independent: This variable can be changed.
- Dependent: The variable that is being tested in an experiment – a scientific test to find things out.
Some examples that could help learners understand:
Growing plants
- The independent variable would be water or the amount of fertiliser
- The dependant variable would be the height of the plant
Fitness
- The independent variable would be the number of steps in a day
- The dependant variable could be resting heart rate
Provide an opportunity for discussion by getting the learners to think about their classroom. Using temperature as the dependant variable the class should work in pairs to think about the things in the classroom that effect temperature e.g. the independent variables. The class should be encouraged to draw their classroom, highlighting the items they think are the independent variables. Alternatively provide a picture of the classroom and ask them to circle the things they consider the independent variables.
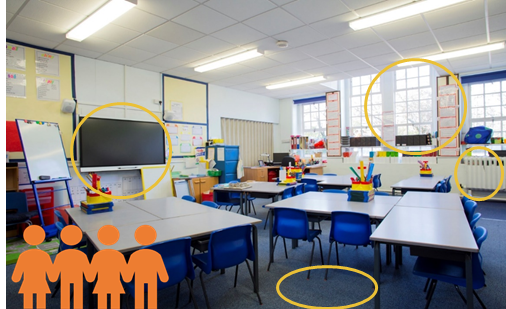
The image provides examples of things that can change the temperature in a classroom. Hold a plenary to share ideas and consider adding the pictures to a classroom display.
Introducing Sensors
Now that the class know about climates, microclimates and variables, we are going to talk about how we can collect information (data) about our microclimates and how this data can help us identify the dependant and independent variables.
A sensor is a device that detects something and converts it into a signal or something you can and understand. Can the class think of any sensors? Encourage them to define what is detected and then what the signal is.
Here are some examples that can help get the discussion started:
- Thermometer: detects the temperature and converts this to a signal by pushing the liquid higher or lower in the tube
- Compass: detects a change in the position of magnetic north and converts that to a movement of the needle.
- Step counter: detects movement of a person and converts it to a number of steps
- Wind vane: detects the flow of air and converts it to a direction using the arrow on the weather vane.
- Speedometer: detects the rotation of car wheels and converts it to a speed.
- Motion sensor (for example if their school lights automatically switch on when they walk into the room): detects movement (most motion sensors work by measuring the change in light as someone passes in front of the sensor) and converts it into an “on” signal for a light.
Using a sensor
Hand out the thermometers to each group. Start by encouraging them to look at the thermometer noting what they see. Can they identify the scale? What do each of the large marks count as? What are each of the smaller marks equal to?
Do all the thermometers in the classroom show the same temperature? If not, can they suggest why not? Ideally they will frame their answer in terms of temperature being the dependant variable and their suggestion as to why the thermometers are not all the same as the independent variable. e.g. they are sitting next to a radiator or by a window and this is impacting temperature as the dependant variable.
Ideally the class can then visit different spaces inside and outside the school building to measure the temperature and note their findings. Things to consider include:
Different inside spaces
- a large gym hall vs. a storage cupboard
- a dark space vs directly under a light
Different outside spaces
- the middle of the playground vs next to a wall or fence
- the bottom of a slope vs the top of a mound
Each group should try and identify two different spaces where they want to measure the temperature. An example worksheet is available. Each group should try and draw the features of the place where they make their measurement. Encourage them to observe the environment, looking for things that might impact their measurements (e.g. they are looking for the independent variables)
Discussion
Each pair or group should discuss the following questions and then share ideas with the class.
- What was the difference in temperature between the other locations and the classroom climate?
- Were these big differences or small differences? What does this tell you?
- What physical features helped create changes in temperature?
Session 3 & 4: A Data Driven Experiment
With learners now familiar with the use of a thermometer the opportunity exists to further their understanding of PPDAC – The Data Problem Solving Cycle.
This extended activity would take the form of a simple experiment and data collection exercise taking temperatures at different places within the school over the course of a few days or weeks and then working with the class to organise the data, present it and draw conclusions. Session 1 would involve explaining PPDAC and designing their experiment (Problem and Plan steps). Data would be collected over an agreed time frame (1 to 2 weeks). The final session would include the analysis and conclusions step.
An example is shown below.
Problem
This step requires learners to identify a question they wish to answer. They question can be derived from the experiment they did in the previous section or they can come up with something else. Encourage questions with quantifiable answers (How much? Rather than Does x happen?). Example questions:
- how much does the temperature in 3 locations around the school change over a week?
- What is the difference in temperature at 3 locations around the school at different times of the day?
Plan
This step requires learners to plan what data they need and how they will collect it. This can be done in small groups or as a class. The output should be a data collection plan, for example.
- The temperature at places x, y, z shall be recorded at 9am, 12pm and 2pm for 1 week.
- The data (temperature readings) will be noted down on our class display/chart.
- After each temperature reading we will also record whether it is raining and whether it is windy.
Data
The data step involves collecting and organising the data in accordance with the data collection plan. This step could be extended to encourage learners to understand other data sources, for example they may also choose to check the weather forecast, interpret maps or charts and add this information to their notes (this step should also be included in their data collection plan).
Analysis
The learners now use the data they collected to understand what is happening around their school. Learners could be encouraged to create a bar chart of the temperature readings at one place over a week. They could create a chart to compare the temperature at different places at the same time each day. This step also presents an opportunity for learner to move the data into a spreadsheet tool and develop skills in creating a table of data. Lastly learners could use pictures to document any relationship they find between temperature and the other things they have noted down, for example wind or rain.
Conclusions
This final step requires learners to answer the question from the “problem step” based on the information they discovered in the “analysis” step. For first level learners this would involve trying to identify simple relationships. For example, the temperature in the playground increases between the morning and afternoon.
Adding the class charts, tables and drawings to a class display can also open up a conversation about data visualisation, how we display information.
© Data Education in Schools, University of Edinburgh, 2024. This resource is licensed CC BY-NC 4.0, unless otherwise indicated.