Download the unit lesson plan, worksheet templates and sample data in Word or PDF
Download the slides as PowerPoint or PDF
Back to main ‘Dear Data’ resource
Lesson 5 Learning Intentions
- I will learn how to create a visualisation from my data
Success Criteria
- Created my own visualisation about my own data
Materials
- Pen/pencil & paper
- Completed Data Collection worksheet (lesson 2)
- Completed Tally Chart worksheet (lesson 3)
- A key for the planned visualisation (lesson 4)
Main Activity
The slides remind learners of the activities from lesson 4 and then encourage them to complete their visualisation.
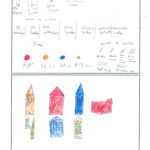
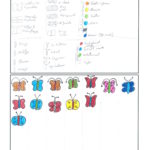
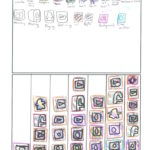
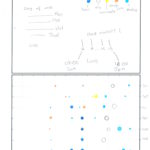
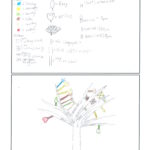
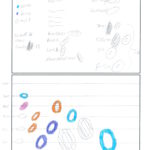
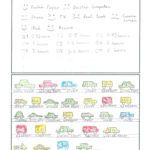
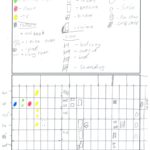
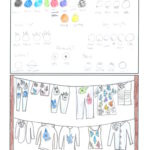
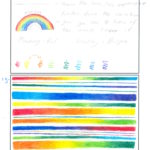
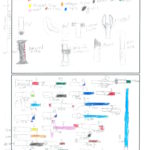
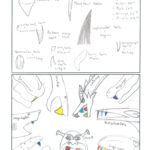
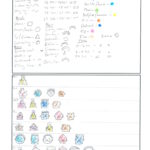
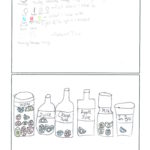
Turning the data into a visualisation, using the key from lesson five and the data from the homework turn every box in the homework into a graphic using the key and layout to correctly encode the results.
Visualisation is part of the analysis step of PPDAC the data problem solving framework.
Learners should use the key they developed in lesson 4 to complete their visualisation. Examples are shown below.