


Download activity as PDF or Word
Introduction
We are going to gather data about sweets and learn how we can explain what we have discovered in a data visualisation.
This activity is a simple way of introducing data analysis and simple visualisation to children. This activity can be done with items commonly available at home with an optional extension to use a computer and internet access.
Materials
- 2 or more small bags of multi-coloured sweets like skittles or M&Ms (or parents get 1 big bag and divide them into smaller groups of multi-coloured sweets)
- Paper, pencil, ruler or a straight edge from something like a box of tissues
- Optional: Use of a computer with Excel, Lego
Activity Detail
Part 1: Collect your data
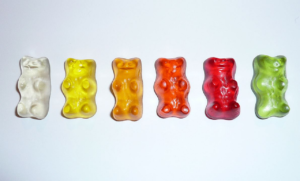
1. Open one bag of sweets and organise them so each colour is in a separate pile.
2. Write down how many sweets of each colour are in the bag. You can do this on a piece of paper using a tally chart or if you prefer you can use a computer and an excel sheet.
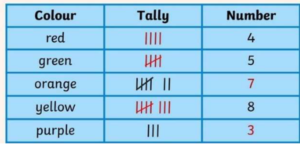
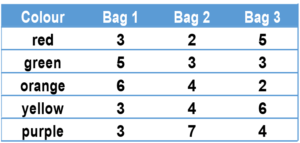
3. Do the same for each bag of sweets that you have. At the end you should have a table that shows how many sweets of each colour are in each bag.
Part 2: Analyse your data
4. Create your axes. Put colour along the bottom and numbers up the side. You can make your axes on paper or using a Lego base.
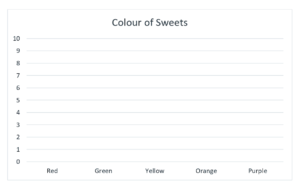
5. Draw a bar for each colour in your first bag. It is important that you use the same colour for all your bars. You can use a ruler or the edge of a box to draw your bars. There are lots of ways you can make your chart.
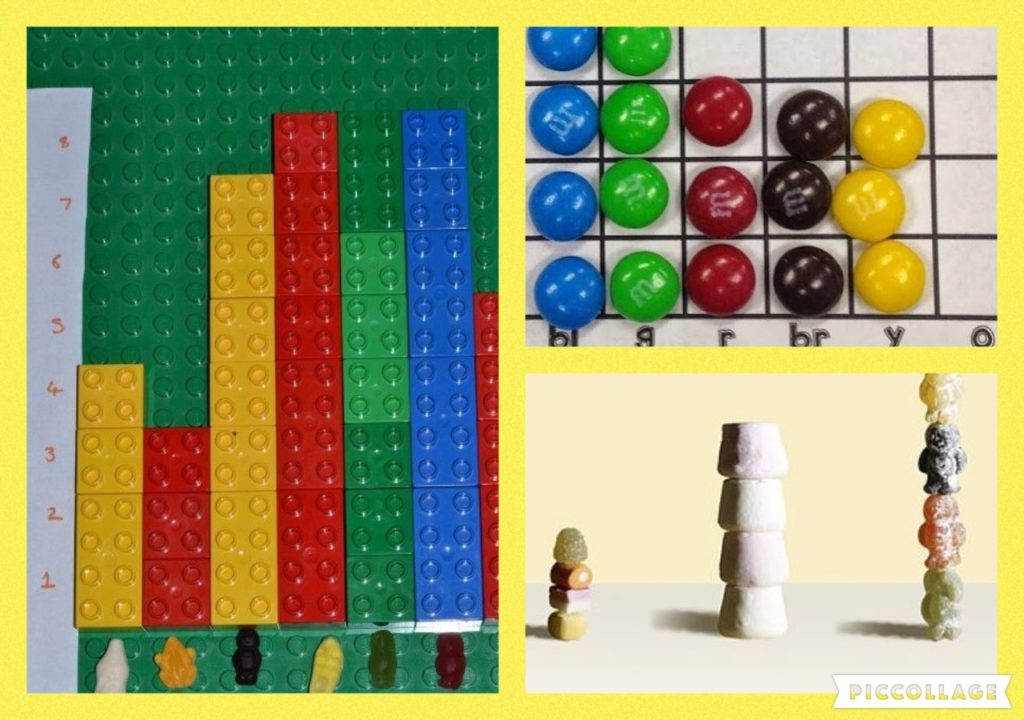
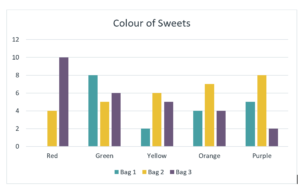
6. Update your chart with more bars for each bag of sweets. This chart shows the results for 3 bags. Don’t forget to add a legend, a place where you show which colour bar is used for each bag.
Conclusion
Use your chart to think about what you can learn about your bags of sweets. Try and answer some of these questions: Do all bags of sweets have the same number of sweets in them? What is the most common colour in each bag? Do all bags have the same combination of colours? Are all colours in all bags?
If you have access to a computer you can extend this activity and practice using tools to create different charts via Tableau.
© Data Education in Schools, University of Edinburgh, 2024. This resource is licensed CC BY-NC 4.0, unless otherwise indicated.